Analysis on Validity of Test Data of Primary Circuit Pressure Boundary Leakage Rate
-
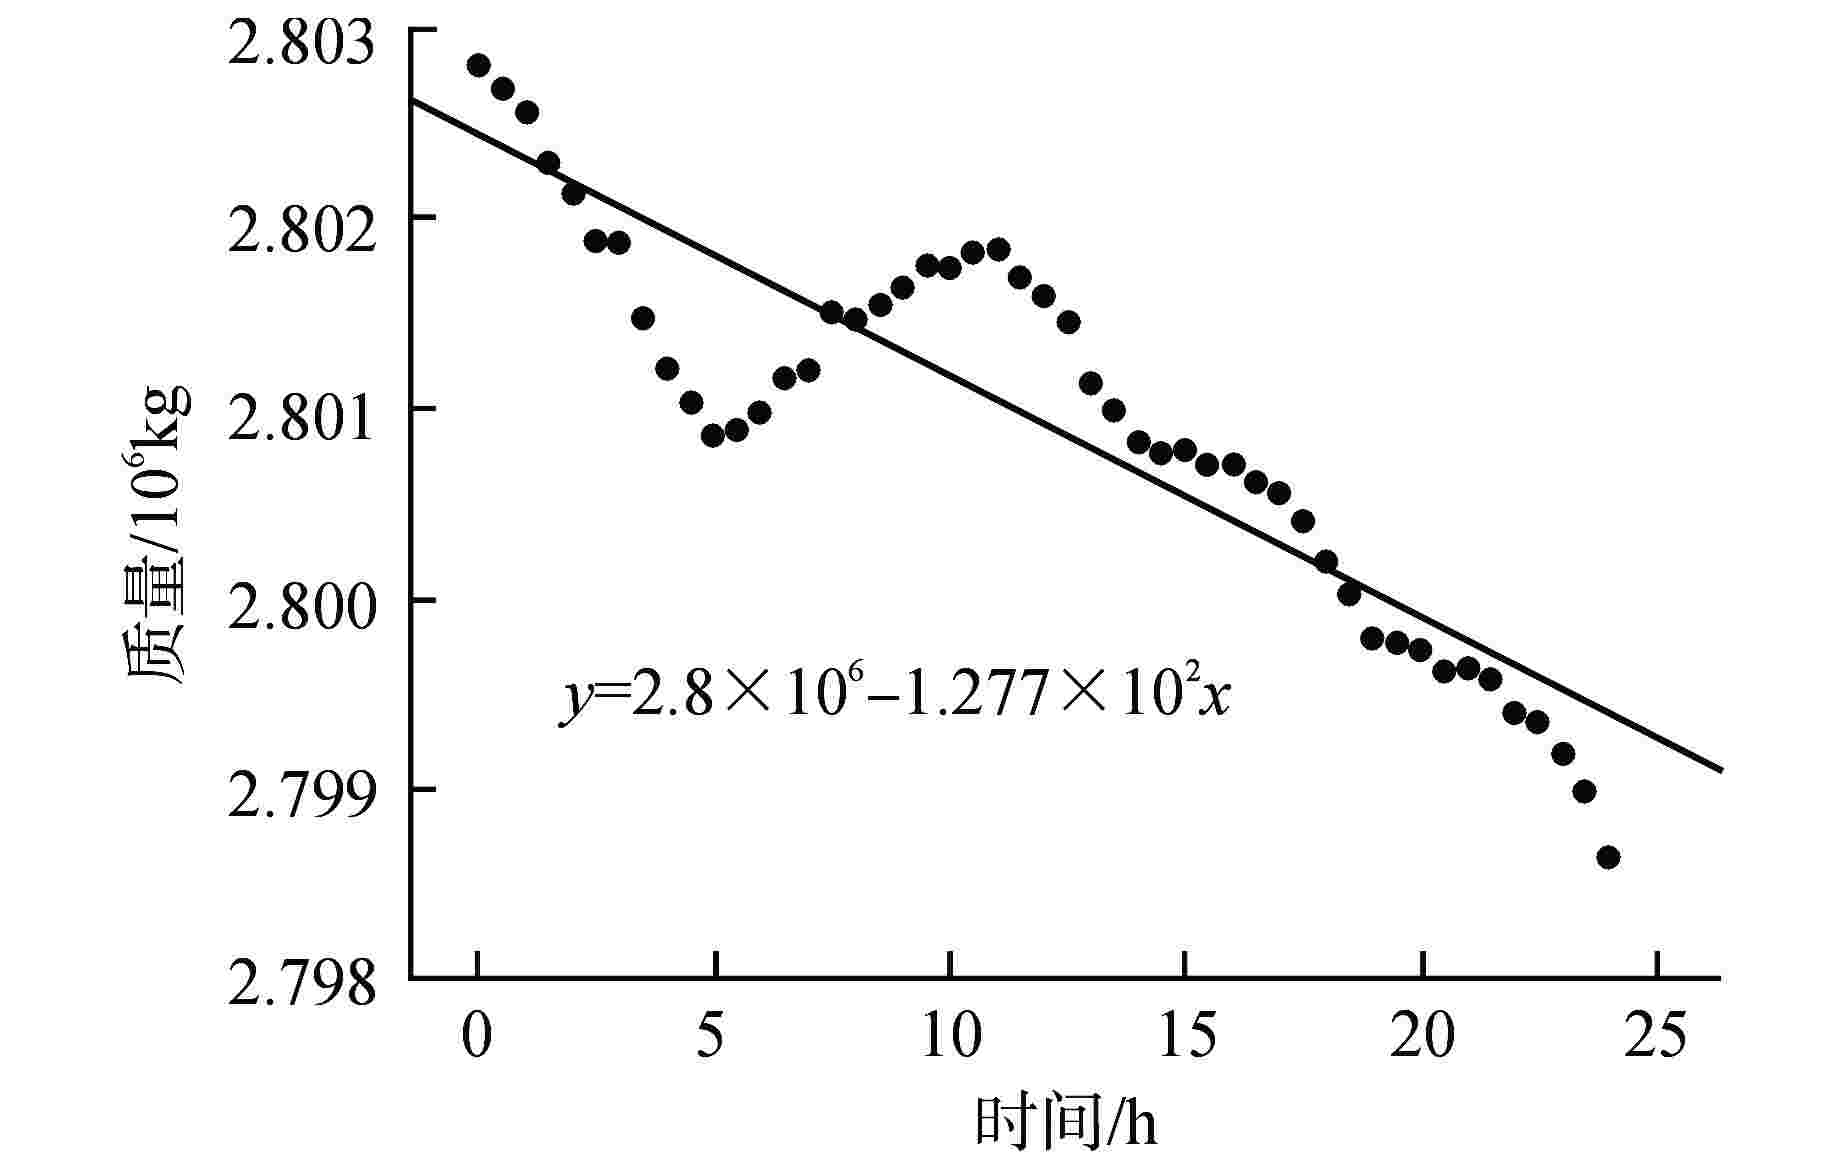
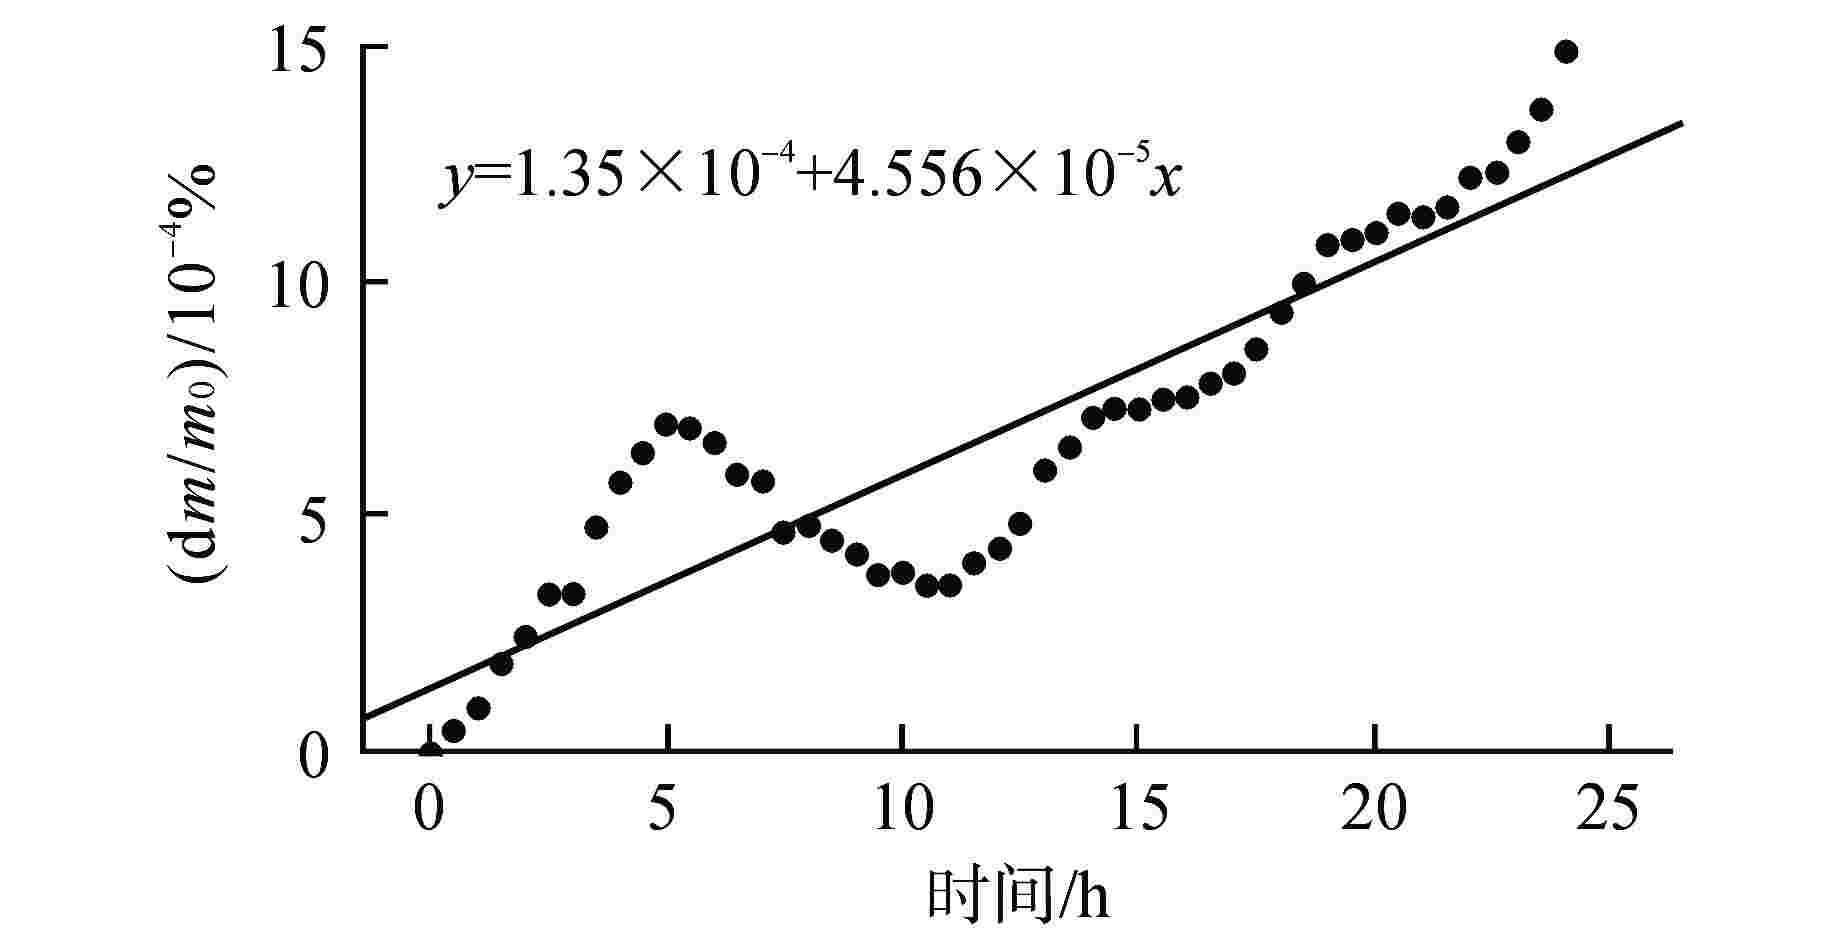
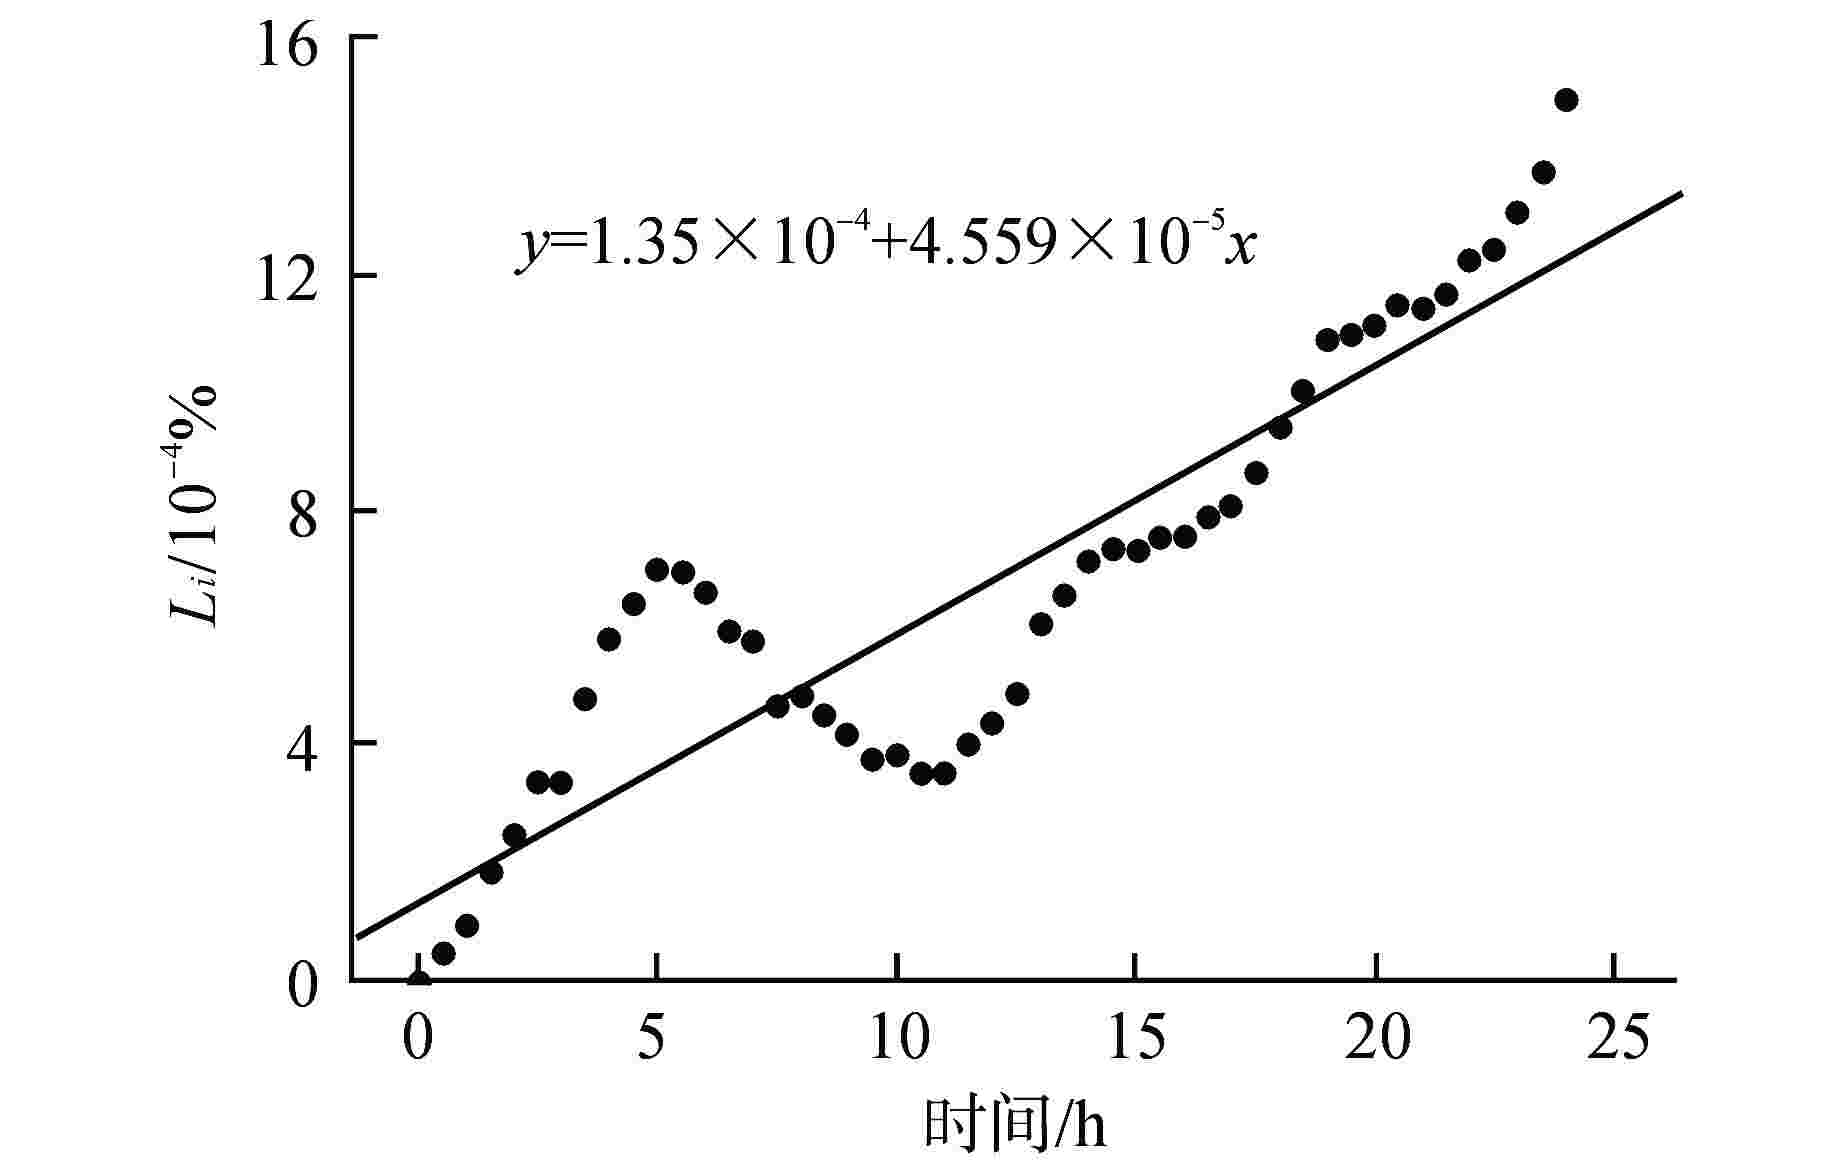
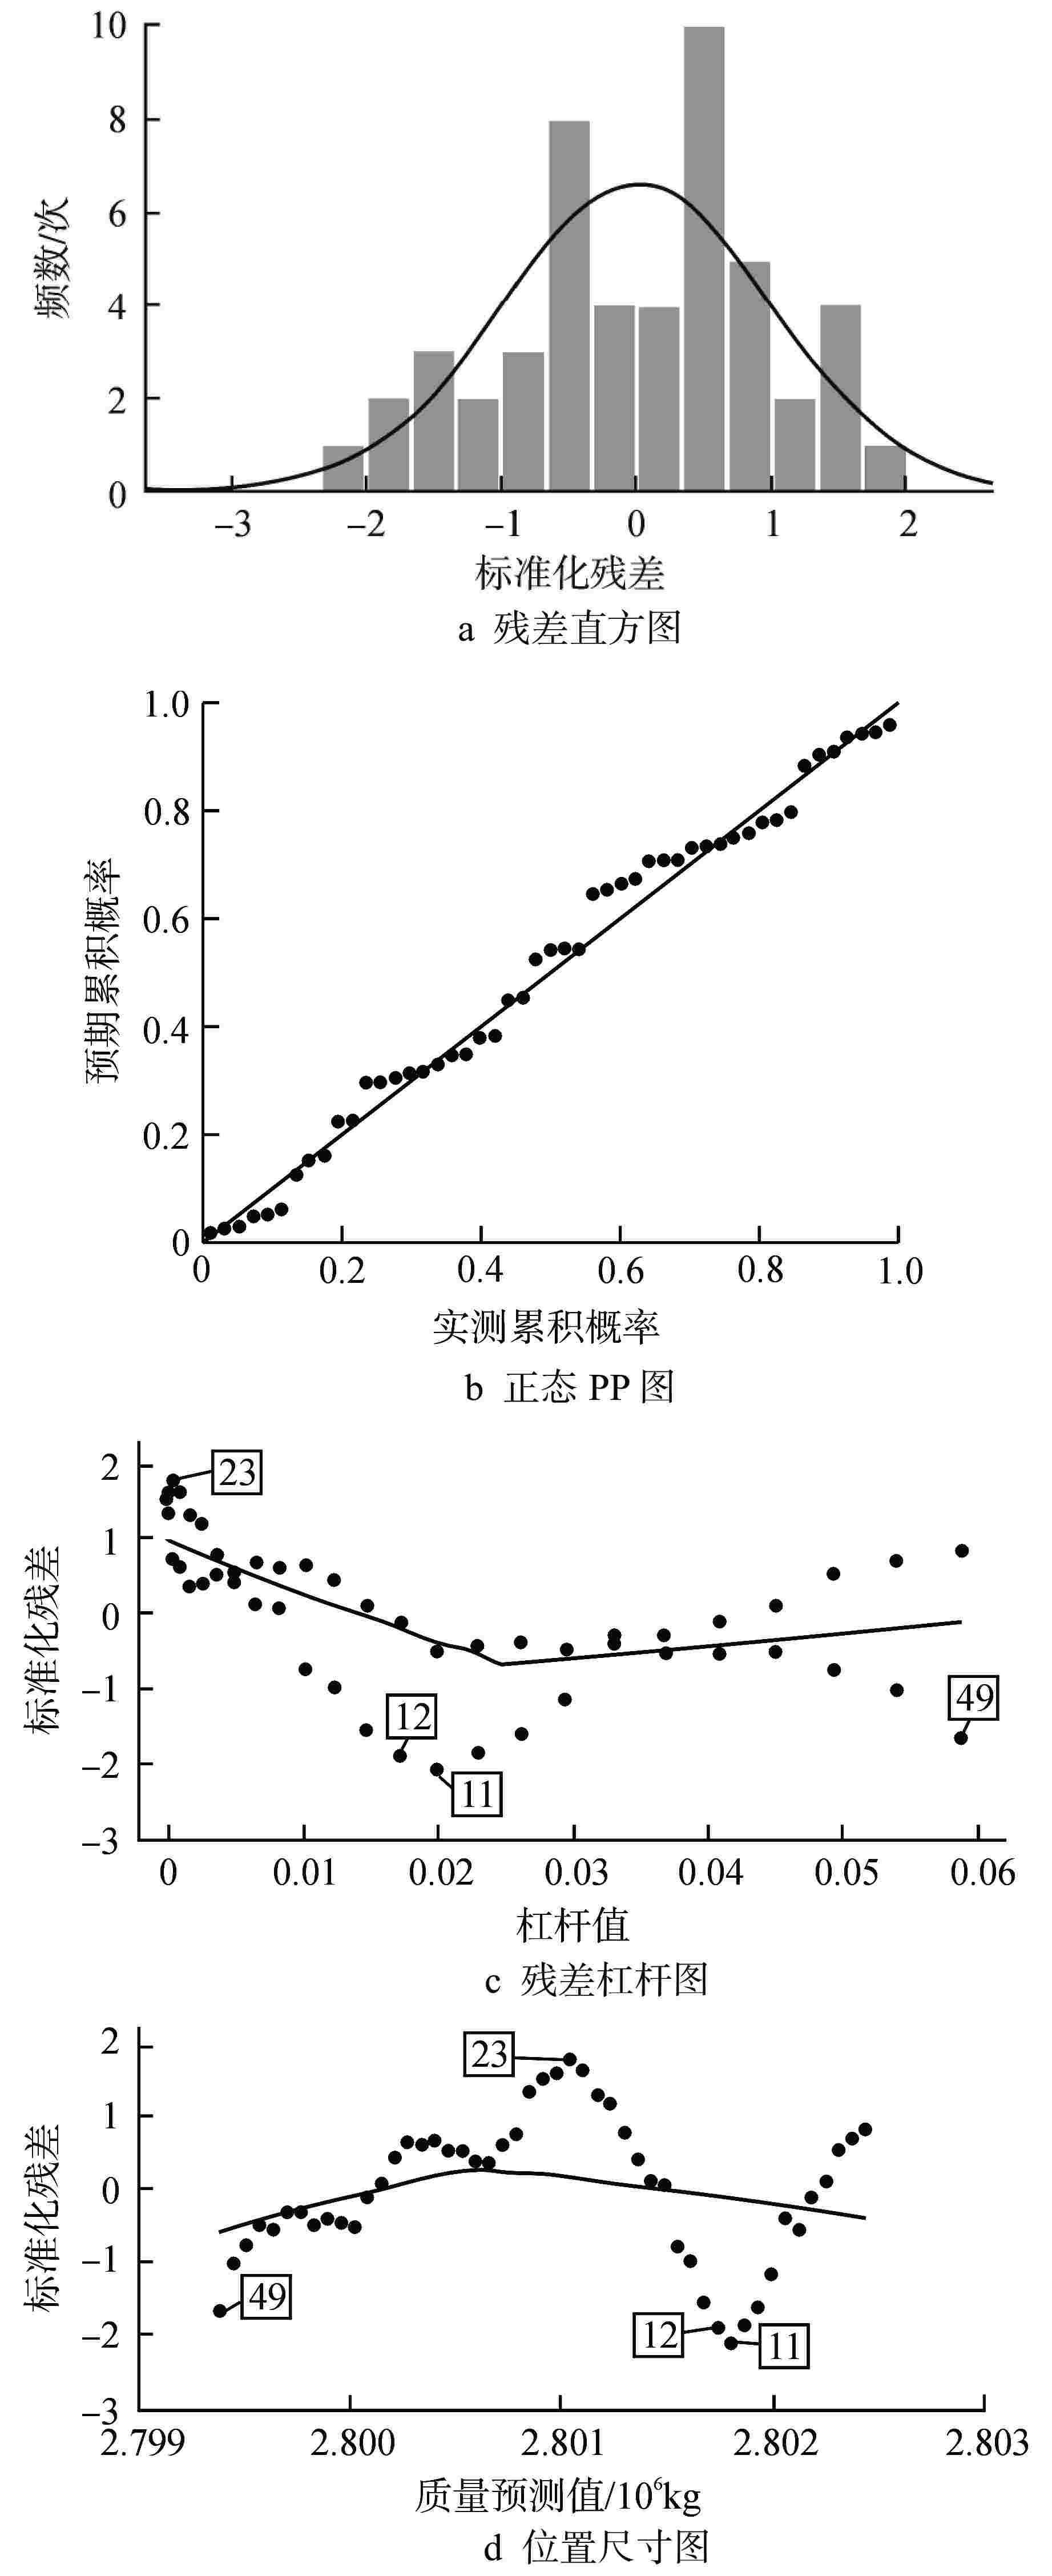
摘要: 某研究性反应堆一回路压力边界气体泄漏率试验受容积小和设备冷却水等因素干扰,试验数据存在极端样本点,在不改变试验方法的基础上,通过使用回归模型的显著性检验和方差分析等方法确保试验结果的有效性。试验方法借鉴压水堆安全壳泄漏率试验方法,本文选用ANSI/ANS-56.8、RCC-G-1988、ПНАЭГ-10-021-90这3种常用的安全壳泄漏率计算方法进行计算分析,结果表明3种方法计算结果基本相同。通过对线性回归模型中残差的独立性、正态性以及等方差性进行分析,探讨回归诊断对计算结果的影响;同时对于回归诊断发现方差不齐、自相关和极端样本点等问题,结合残差加权最小二乘法和去除极端样本点对最终结果进行修正,提高了结果的可靠性。本文分析方法已应用到核安全审评中。Abstract: The primary circuit pressure boundary gas leakage rate test of a research reactor is interfered by small volume, equipment cooling water and other factors, and there are extreme sample points in the test data. On the basis of not changing the test method, the effectiveness of the test results is ensured by using the significance test and variance analysis of the regression model. The test method draws lessons from the test method of containment leakage rate of PWR. In this paper, three commonly used methods for calculating the leakage rate of the containment, including ANSI/ANS-56.8, RCC-G-1988, and ПНАЭГ-10-021-90, are used for calculation and analysis. The results show that the calculation results of the three methods are basically the same. By analyzing the independence, normality and variance property of residuals in linear regression model, the influence of regression diagnosis on the calculation results is discussed. At the same time, for the problems of heterogeneity of variance, autocorrelation and extreme sample points found in regression diagnosis, the final results are modified by combining the residual weighted least square method and removing extreme sample points, and the reliability of the results is improved. The analysis method in this paper has been applied to nuclear safety review.
-
Key words:
- Primary circuit pressure boundary /
- Regression diagnosis /
- Leakage rate
-
表 1 去除极端样本点前后的显著性对比
Table 1. Comparison of Significance Before and After Removing Extreme Sample Points
参数 去除极端样本点前 去除极端样本点后 A B 整体显著性 A B 整体显著性 估计值 −127.699267 2802441.675127 −128.820616 2802493.679714 标准差 9.091085 126.624164 8.354202 116.518745 t检验值 −14.046647 22131.965941 −15.419858 24051.869699 F检验统计量 197.308303 237.772031 P值 1.9304×10⁻¹⁸ 1.3866×10−166 1.9304×10⁻¹⁸ 3.9538×10⁻¹⁹ 6.4991×10−155 3.9538×10⁻¹⁹ R2 0.807620 0.846851 调整R2 0.803527 0.843289 自由度 48 44 表 2 残差加权后的结果
Table 2. Results after the Residual Is Weighted
参数 去除极端样本点前 去除极端样本点后 A B A B 估计值 −130.336 2802480.747 −128.499 2802495.153 标准差 2.552 30.024 0.847 2.610 t检验值 −51.067 9.334×10⁴ −151.653 1.073×10⁵ P值 7.8×10−43 5.8×10−196 2.5×10−60 7.5×10−226 表 3 泄漏率结果的对比
Table 3. Comparison of Leakage Rate Results
条件 Lam/% 影响程度/% R2 1 0.10934 0.807620 2 0.11032 +0.896 0.846851 3 0.11162 +2.085 0.982297 4 0.11004 +0.640 0.998134 -
[1] 孔祥波,王纳秀,林良程,等. 高温熔盐试验回路系统设计及验证研究[J]. 核动力工程,2020, 41(5): 127-131. [2] American Nuclear Society. American national standard containment system leakage testing requirements: ANSI/ANS-56.8-2002[S]. La Grange Park: American Nuclear Society, 2002: 5-11. [3] EDF. Design and construction rules for civil works for PWR nuclear islands: RCC-G volume Ⅰ-design-1988[S]. Avenue Dutrievoz: EDF Equipment EEPTEN, 1988: 365-369. [4] 褚英杰,欧阳钦. 安全壳整体泄漏率计算方法的比较分析[J]. 核动力工程,2010, 31(6): 33-37. [5] 薛文博,陈士军. 关于安全壳整体密封试验的俄标与美标差异分析[J]. 商品与质量,2016(47): 362-363. [6] 国家能源局. 核电厂安全壳密封性试验: NB/T 20018-2010[S]. 北京: 原子能出版社, 2010: 8-15. [7] 彭巧云,惠爽爽,李彦华. 安全壳整体密封性试验泄漏率的计算方法[J]. 科技创新导报,2013(10): 26-27. doi: 10.16660/j.cnki.1674-098x.2013.10.034 [8] 时朝杰. 核电厂安全壳泄漏率数据增大的分析及处理[J]. 科技视界,2016(8): 95-96. doi: 10.19694/j.cnki.issn2095-2457.2016.08.067 [9] 陈希孺. 概率论与数理统计[M]. 合肥: 中国科学技术大学出版社, 2009: 264-268. [10] 沈东明,蔡建涛,何锐,等. 基于统计软件R的安全壳泄漏率试验数据有效性分析[J]. 核动力工程,2020, 41(5): 99-103. [11] 沈东明,何锐,张骥. 基于时间序列分析方法对安全壳泄漏率测量阶段的气体弛豫过程研究[J]. 核动力工程,2021, 42(5): 178-181. -


 下载:
下载:
