Characterization Analysis of Core Outlet Temperature Measurement in Nuclear Power Plants
-
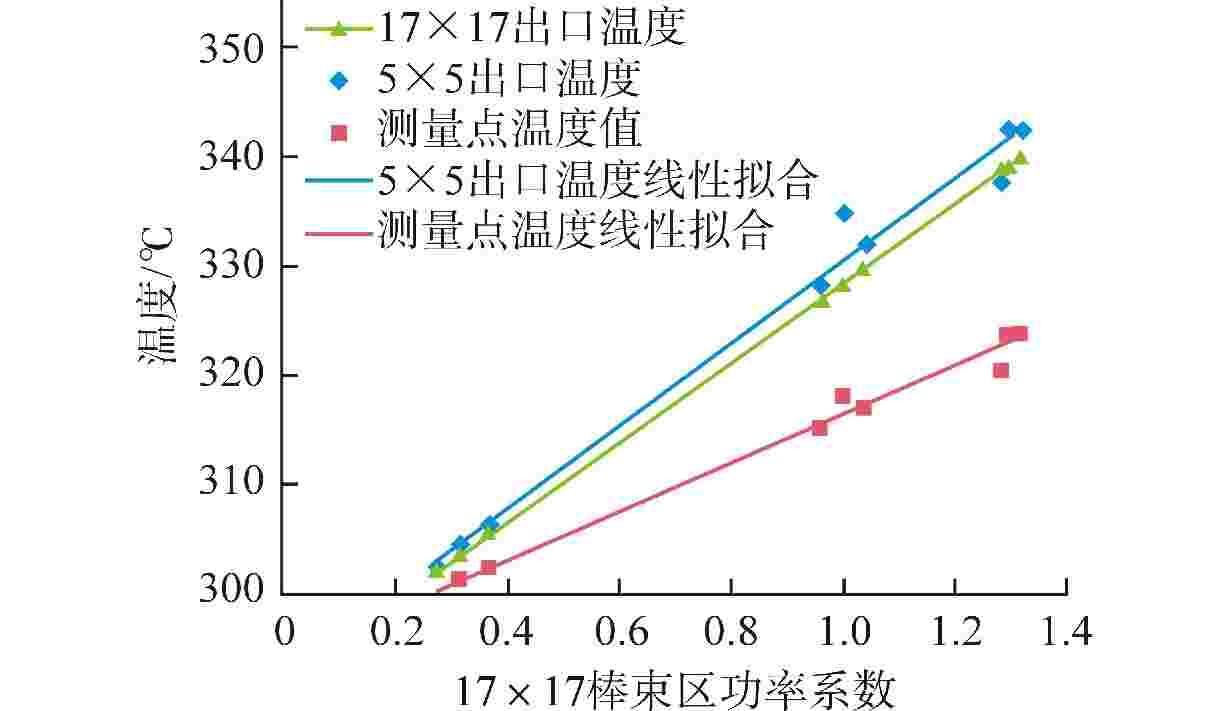
摘要: 堆芯出口温度测量对于掌握反应堆运行状态有着重要的意义,本文通过计算流体动力学(CFD)方法对堆芯出口温度测量的表征性进行分析。通过对燃料组件及仪表管结构进行模拟计算,获得了仪表管内冷却剂流场和温度分布;通过对9种典型功率分布下堆芯出口温度测量结果的定量分析,获得了堆芯出口温度表征性与燃料组件功率的关系。结果显示,测点平均温度与燃料棒功率基本呈线性关系,其测点温度随燃料棒功率的增加而增加,测温表征性随燃料棒功率的升高而变差。研究结果为堆芯出口温度测量的校正提供了一定的依据。
-
关键词:
- 堆芯出口 /
- 温度测量 /
- 计算流体动力学(CFD)
Abstract: The core outlet temperature measurement is of great significance for mastering the reactor operation status. This paper analyzed the characterization of the core outlet temperature measurement by computational fluid dynamics (CFD) method. By simulating the structure of the fuel assembly and instrument tube, the coolant flow and temperature distributions in the instrument tube were obtained. The relationship between core outlet temperature characterization and fuel assembly power was obtained through quantitative analysis of core outlet temperature measurement results under 9 typical power distributions. The calculation results show that the average temperature of the measurement point is basically linearly related to the power of the fuel rod, and the temperature value of the measurement point increases with the increase of the power of the fuel rod, while the characterization of the temperature measurement becomes worse with the increase of the power of the fuel rod. The research results provide a certain basis for the calibration of outlet temperature measurement.-
Key words:
- Core outlet /
- Temperature measurement /
- Computational fluid dynamics (CFD)
-
表 1 分析采用的功率系数
Table 1. Power Coefficient Used for Analysis
算例 燃耗时刻 5×5棒束区功率系数 17×17棒束区功率系数 1 寿期初 0.26 0.27 2 寿期中 0.31 0.31 3 寿期末 0.35 0.37 4 寿期中 0.93 0.96 5 寿期初 1.11 1.00 6 寿期末 0.99 1.04 7 寿期初 1.18 1.28 8 寿期末 1.25 1.29 9 寿期中 1.31 1.32 表 2 各截面流量和温度
Table 2. Flow and Temperature at Each Section
算例 截面01 截面02 截面03 流量/(kg·s−1) 平均温度/℃ 流量/(kg·s−1) 平均温度/℃ 流量/(kg·s−1) 平均温度/℃ 1 0.050 292.1 0.122 292.5 0.189 299.7 2 0.050 292.1 0.123 292.7 0.191 301.1 3 0.050 292.1 0.122 293.0 0.191 302.3 4 0.051 292.1 0.123 294.0 0.190 314.9 5 0.050 292.1 0.123 293.1 0.192 318.1 6 0.051 292.1 0.123 294.7 0.192 317.0 7 0.050 292.1 0.122 293.4 0.189 320.4 8 0.050 292.1 0.122 295.4 0.189 323.4 9 0.050 292.1 0.122 294.4 0.189 323.7 表 3 各算例计算结果
Table 3. Calculation Results of All Cases
算例 测点温度/℃ 5×5棒束区出口温度/℃ 17×17棒束区出口温度/℃ 测点与5×5棒束出口温差/℃ 测点与17×17棒束区出口温差/℃ 1 299.7 302.2 302.0 2.47 2.28 2 301.1 304.1 303.6 3.02 2.50 3 302.3 306.3 305.4 4.01 3.14 4 314.9 328.1 326.9 13.18 12.01 5 318.1 334.8 328.4 16.69 10.33 6 317.0 332.0 332.0 14.91 14.91 7 320.4 338.7 338.7 17.23 18.30 8 323.4 339.1 339.1 18.81 15.64 9 323.7 340.0 340.0 18.65 16.24 -
[1] 杜思佳,刘余,李松蔚,等. “华龙一号”反应堆本体结构CFD模型研究[J]. 热科学与技术,2017, 16(5): 411-417. doi: 10.13738/j.issn.1671-8097.2017.05.012 [2] 任春明,杜思佳,邓坚,等. 三代核电先进堆型热管段温度搅混及温度测量特性研究[J]. 核动力工程,2021, 42(3): 203-206. doi: 10.13832/j.jnpe.2021.03.0203 [3] 薛秀丽,杨红义,杨福昌. 中国实验快堆堆芯出口区域温度监测点布置计算验证[J]. 原子能科学技术,2008, 42(5): 428-433. -


 下载:
下载:
