Analysis and Solution to Abnormity of DNBR Indicated by ICIS of a WWER Unit
-
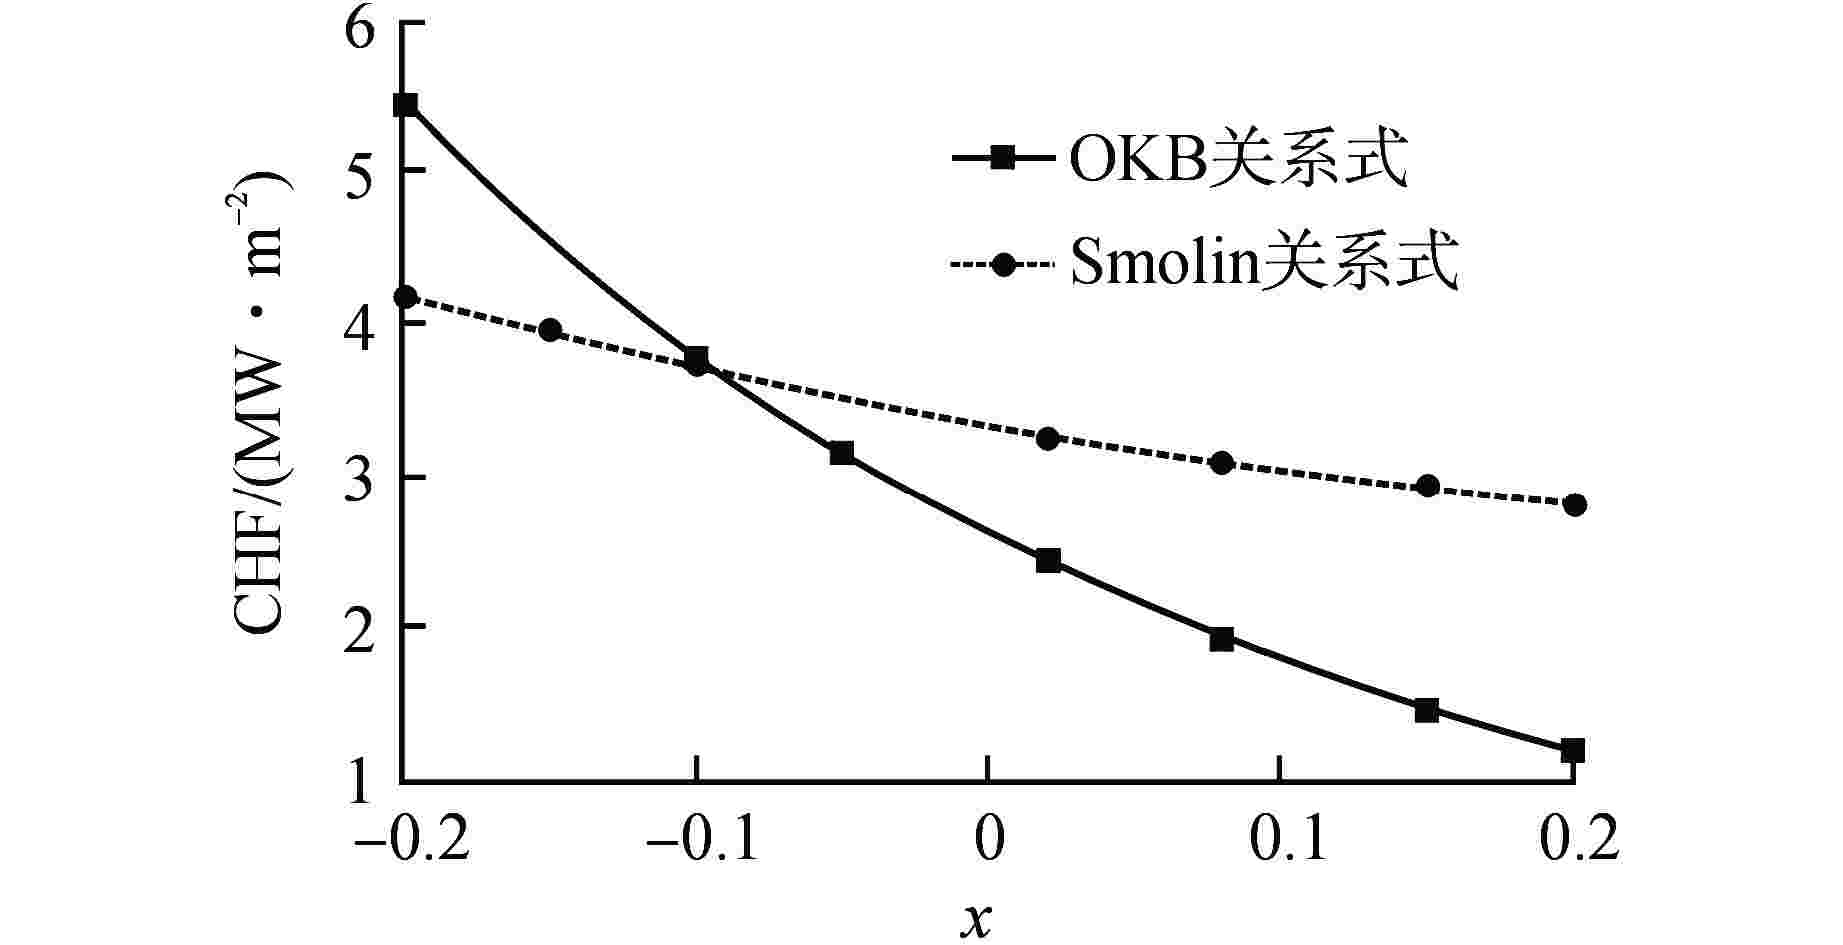
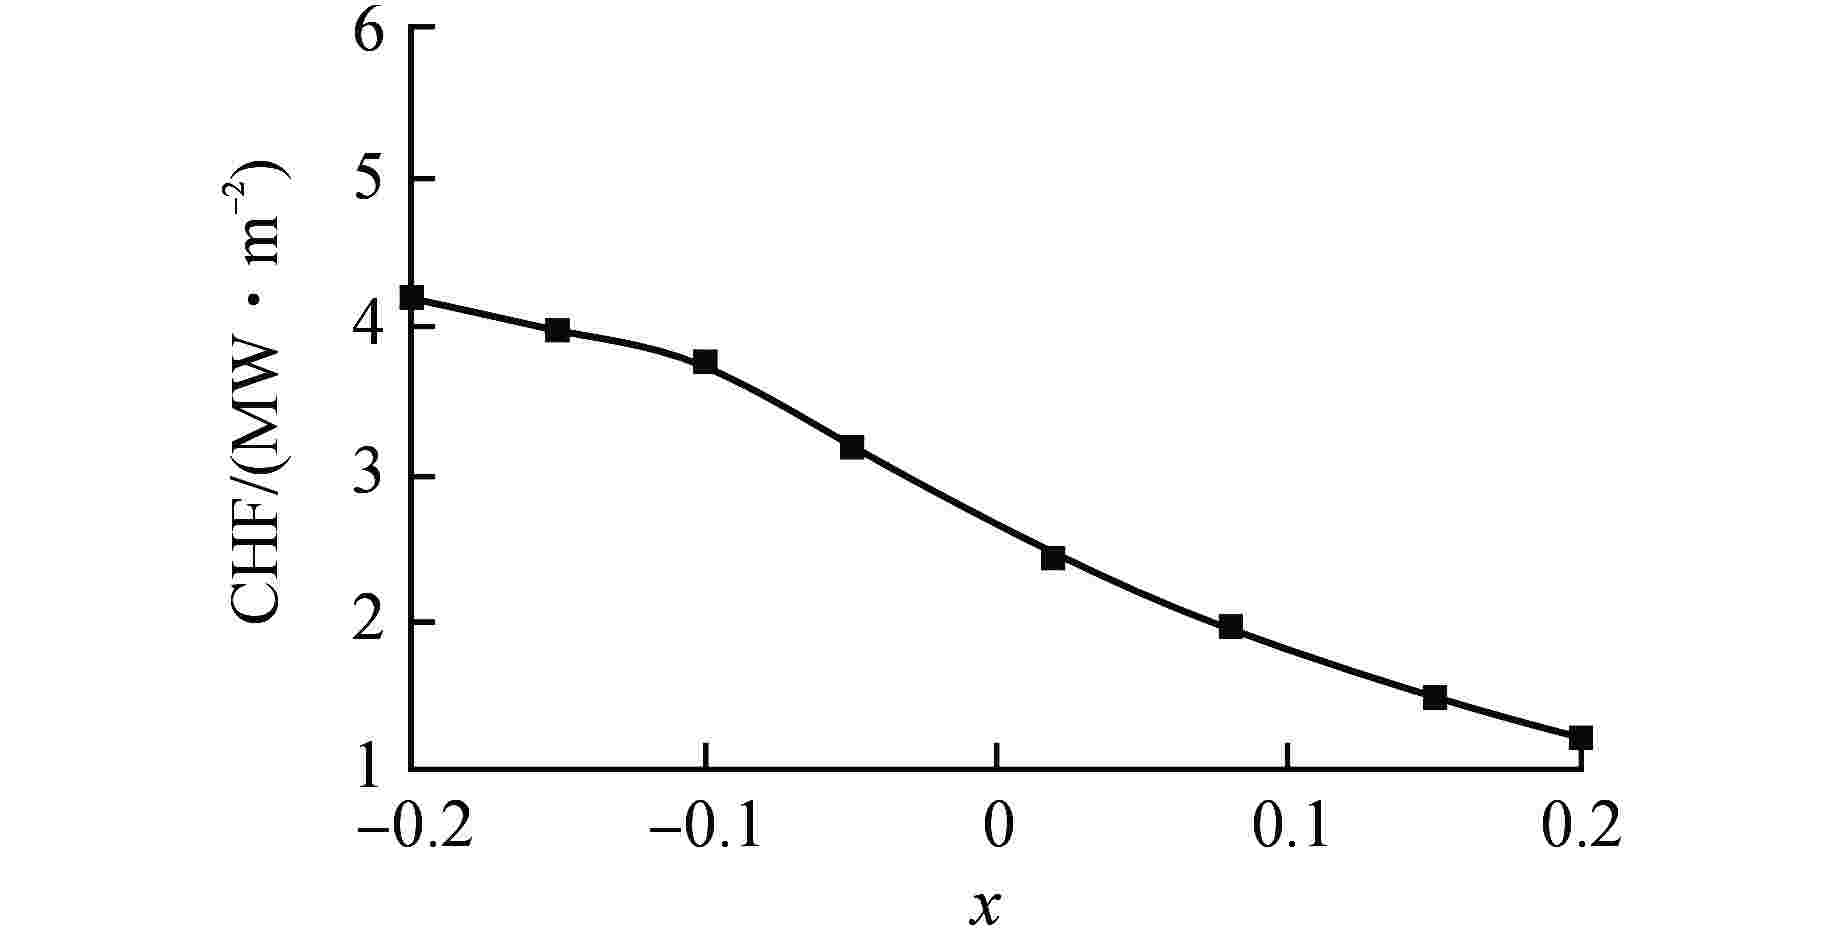
摘要: 为分析国内某水冷却水慢化动力堆(WWER)机组在首次热试升功率期间出现堆内仪表系统(ICIS)上、下层软件指示的偏离泡核沸腾比(DNBR)不一致的原因,通过研究WWER机组热工水力设计和事故分析程序采用的临界热流密度(CHF)关系式,并采用WWER机组事故分析程序DINAMIKA-97模拟50%、75%和90%功率平台工况,计算其DNBR并与热工水力测量试验的测量值进行比较,判断差异产生原因为ICIS上、下层软件采用了不同的CHF关系式;对100%功率平台的DNBR进行预测,与后续下层软件热工水力测量试验测量值符合得良好,进一步证实了以上判断。因此,建议对ICIS上、下层软件采用的CHF关系式进行修改,统一采用保守的CHF关系式,以取得保守的DNBR。
-
关键词:
- 水冷却水慢化动力堆(WWER) /
- 偏离泡核沸腾比(DNBR) /
- 临界热流密度(CHF) /
- 堆内仪表系统(ICIS)
Abstract: To analyze the reason of difference between the departure from nucleate boling ratio (DNBR) indicated by the upper-level software and lower-level software of the in-core instrumentation system (ICIS) at a certain water-cooled water-moderated power reactor (WWER) unit under its first thermal test during raising power, an investigation was made on the critical heat flux (CHF) correlations adopted in the reactor thermal and hydraulic design and accident analysis of WWER unit. On the above basis, the reason behind the difference was found to be the use of different CHF correlations by the upper-level software and the lower-level software of ICIS through the simulation of thermal tests under 50%, 75% and 90% power level using WWER accident analysis code DINAMIKA-97, calculation of DNBRs and comparison with the ones measured in thermal-hydraulic tests. DNBR under 100% power level was predicted, which coincided with the measured DNBR very well and proved the correctness of the guess further. It is suggested that the CHF correlations adopted by the upper-level software and the lower-level software shall be modified to the same conservative CHF correlation to get a conservative DNBR. -
表 1 初始条件参数对比
Table 1. Comparison of Initial Condition Parameters
参数 参数值 热工水力测量试验 DINAMIKA-97程序 反应堆相对功率/% 49.6 49.6 环路冷管段温度/℃ 283.85 283.95 环路热管段温度/℃ 298.73 298.96 环路冷却剂流量/(m3·h−1) 22278 22246 反应堆冷却剂流量/(m3·h−1) 89111 88974 堆芯上部压力/MPa 15.7 15.7 SG出口压力/MPa 6.21 6.22 主泵压差/MPa 0.60 0.592 表 2 堆芯功率对比
Table 2. Comparison of Core Power
参数 参数值 热工水力测量试验 DINAMIKA-97程序 QLmax/(W·cm−1) 176 176 Kr 1.60 1.60 QLmax—峰值线功率密度;Kr—径向功率分布因子 表 3 堆芯轴向功率分布对比
Table 3. Comparison of Core Axial Power Distribution
热工水力测量试验 DINAMIKA-97程序 H/% Kz H/% Kz 7.1 0.698 5 0.698 21.4 1.152 15 0.957 35.7 1.392 25 1.186 50.0 1.311 35 1.392 64.3 1.147 45 1.334 78.6 0.867 55 1.264 92.9 0.434 65 1.147 — — 75 0.907 — — 85 0.681 — — 95 0.434 H—距堆芯底部相对位置;Kz—相对功率密度;“—”—无此项 表 4 各功率平台下的最小DNBR对比
Table 4. Comparison of Minimum DNBR under Different Power Level
方式 最小DNBR 50%功率 75%功率 90%功率 100%功率 ICIS上层软件 11.24 6.79 4.94 3.99 ICIS下层软件 4.7 3.26 2.71 2.45 DINAMIKA-97程序 5.01 3.4 2.8 2.59 -
[1] 姚进国. WWER-1000燃料组件特点及棒弯曲分析[J]. 核动力工程,2006, 27(S1): 43-46. [2] 姚进国,杨晓强,李载鹏,等. 线功率密度和DNBR保护在田湾核电站的应用[J]. 核动力工程,2012, 33(S1): 119-122. [3] 江苏核电有限公司. 田湾核电站3、4号机组工程项目最终安全分析报告[R]. 江苏: 江苏核电有限公司, 2016. [4] SMOLIN V N, SHPANSKY S V, ESIKOV V I, et al. Experimental data and prediction of crisis in boiling water in tubes (for uniform and nonuniform heat flux)[J]. Problems of Atomic Science and Engineering-Physics and Engineering of Nuclear Reactors, 1979, 5(9): 3-154. -


 下载:
下载:


