


Research and Engineering Application of Xenon Dynamic-Flux Measurement Method for M310 Unit Based on Bamboo-C Code
-
摘要: 为优化M310机组现行技术要求的在升功率达到指定功率水平后等待24 h再实施堆芯测量试验的时间,进一步提升压水堆核电厂的经济性,本文基于西安交通大学自主研发的先进压水堆堆芯物理分析软件Bamboo-C,研发了动态氙条件下实施堆芯通量测量的新方法。通过动态氙通量测量数据预测平衡氙条件下堆芯功率分布实测值,并在田湾核电站5号机大修中进行了工程应用验证。验证结果表明,本文提出的动态氙通量测量方法可以将指定功率水平下的氙平衡等待时间缩短至2 h,且对堆芯关键物理量具有很高的预测精度。
-
关键词:
- 动态氙 /
- 通量测量试验 /
- Bamboo-C软件
Abstract: In order to optimize the current technical requirements of M310 unit, i.e. to wait for 24 h after the power increases to the specified power level to perform in-core flux measurement test, so as to further improve the economy of PWR nuclear power plant, a new method for core flux measurement under dynamic xenon conditions is developed based on Bamboo-C, an advanced PWR core physical analysis software independently developed by Xi'an Jiaotong University. Based on the dynamic xenon flux measurement data, the measured values of core power distribution under the condition of balanced xenon were predicted, and the engineering application was verified in the overhaul of Tianwan No.5 unit. The verification results show that the dynamic xenon flux measurement method proposed in this paper can shorten the waiting time of xenon balance to 2 h at a specified power level, and has high prediction accuracy for key physical quantities in the core.-
Key words:
- Dynamic xenon /
- Flux measurement test /
- Bamboo-C code
-
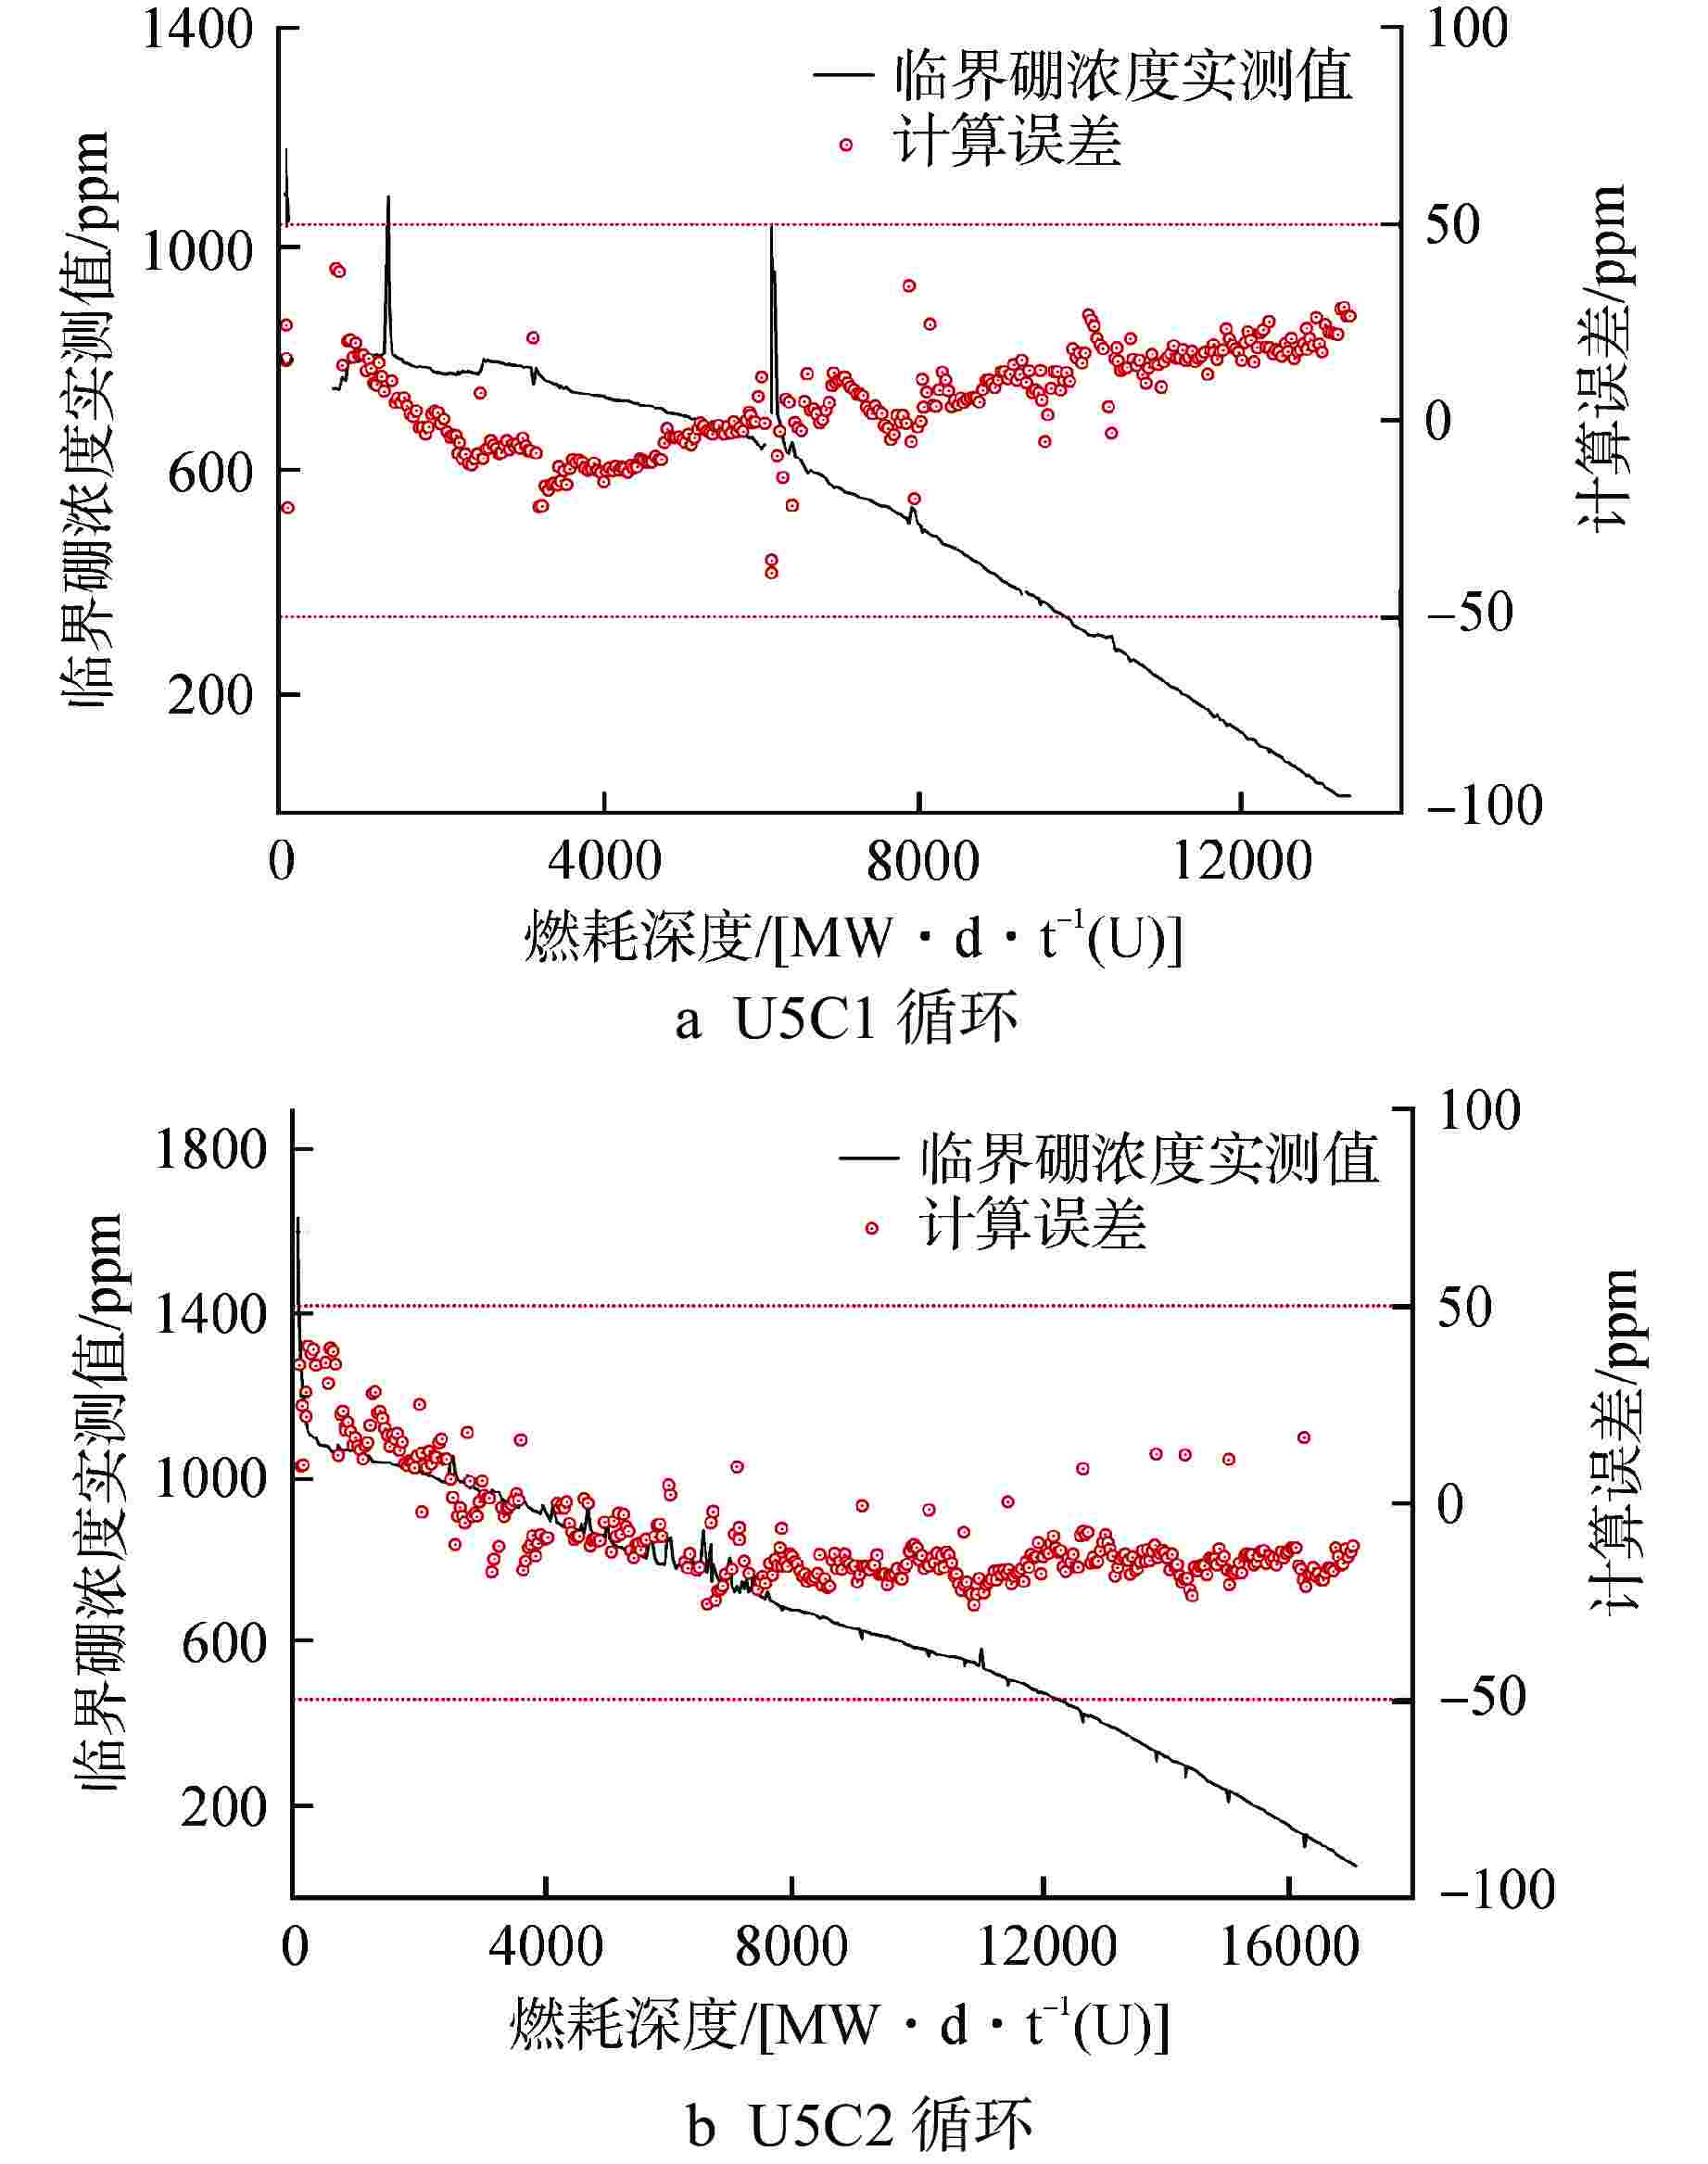
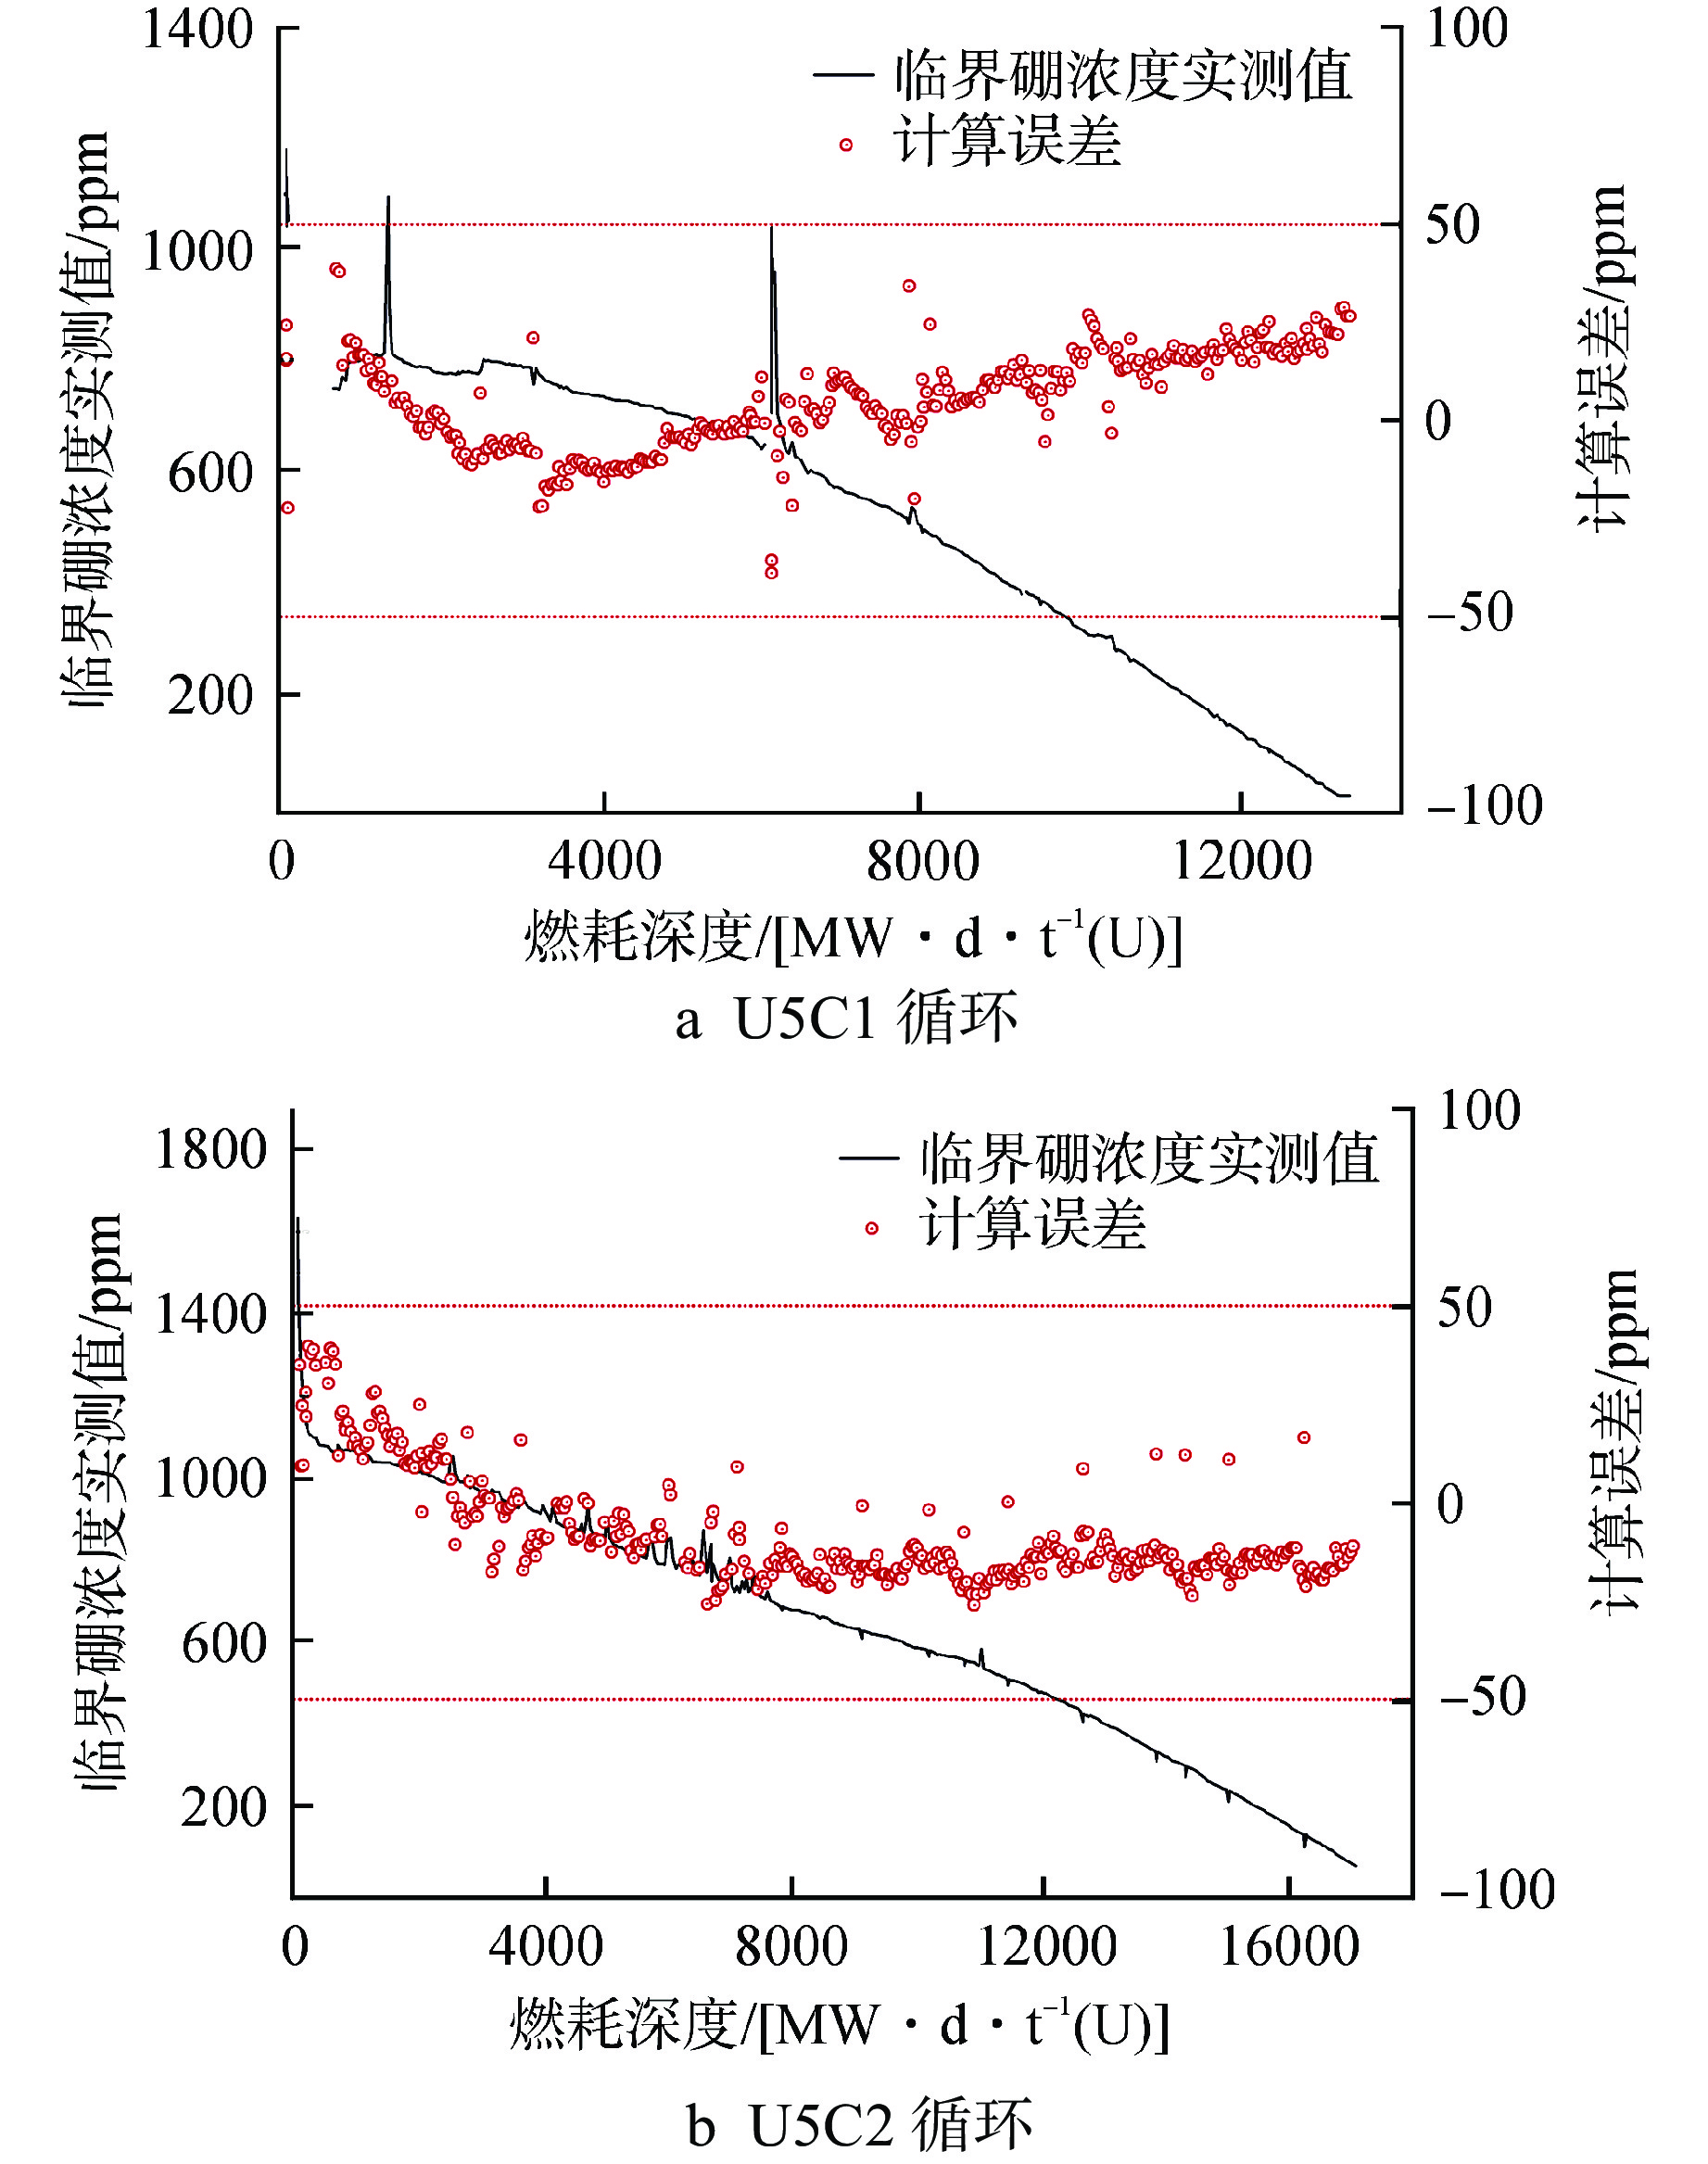
图 1 堆芯运行过程中临界硼浓度计算值与实测值的偏差
Figure 1. Deviation Between Calculated Value and Measured Value of Critical Boron Concentration During Core Operation
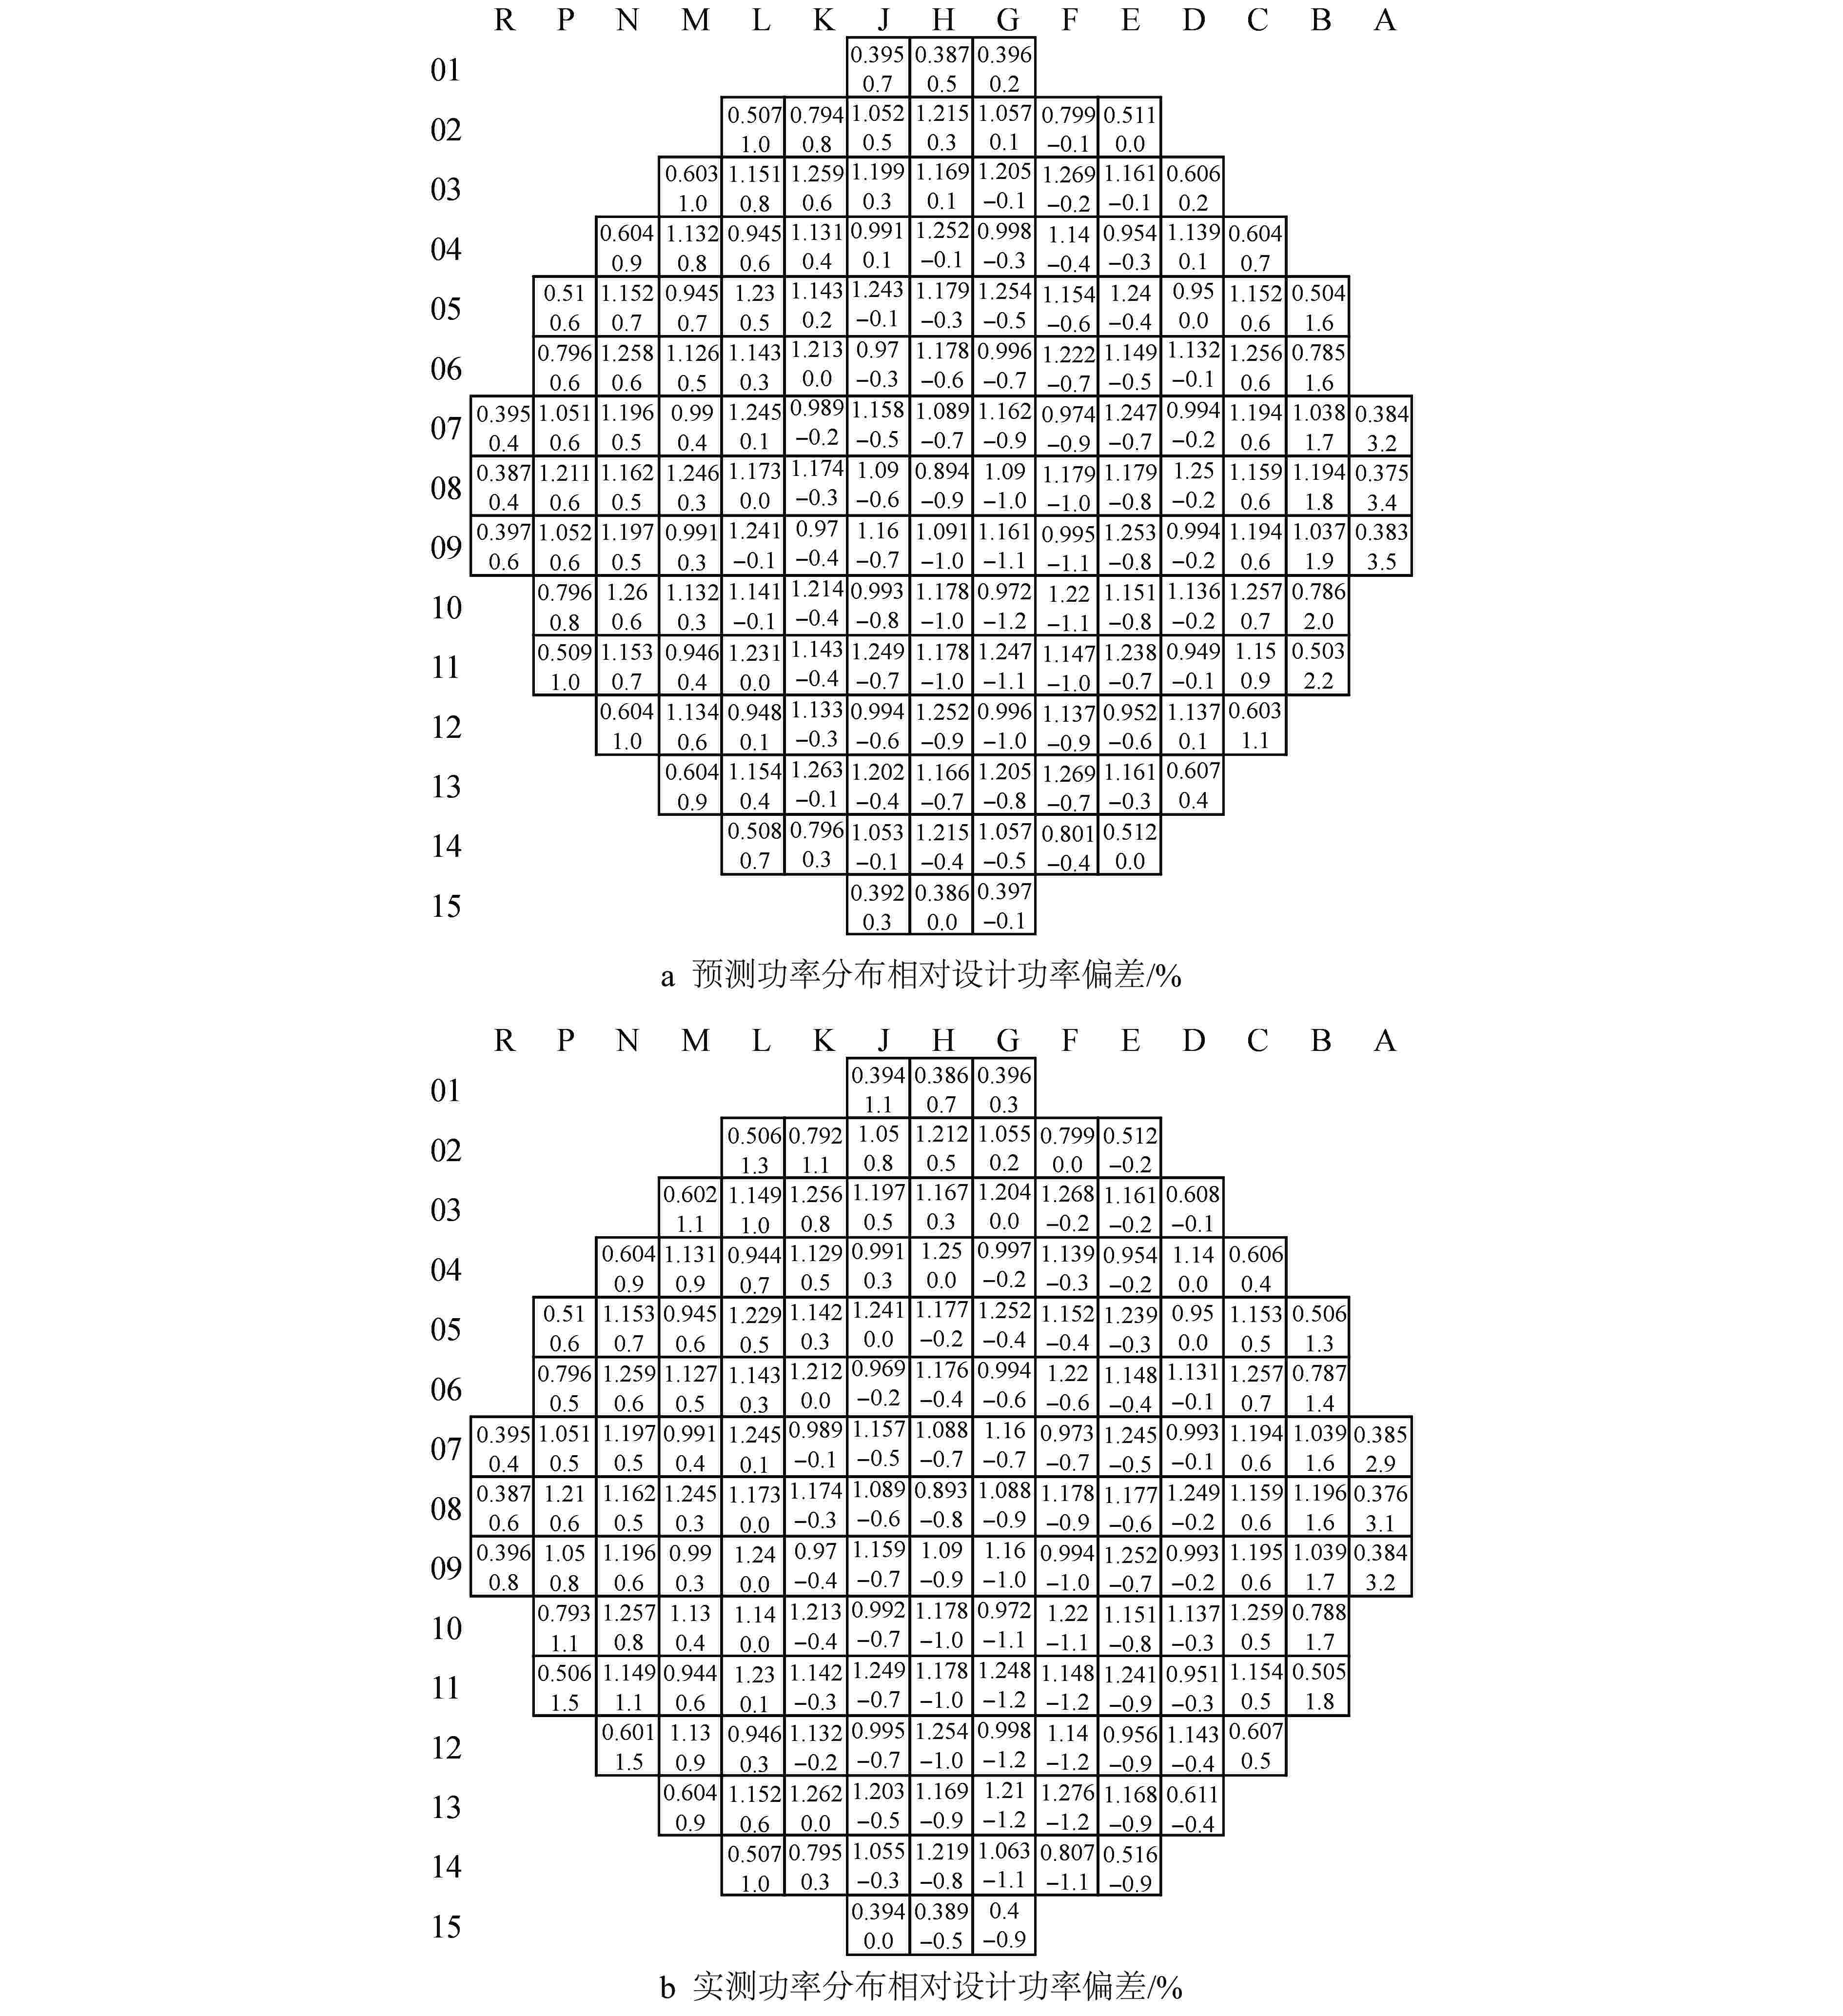
图 2 75%FP下稳定2 h预测至24 h与稳定24 h实测值堆芯功率分布验证结果
Figure 2. Validation Results of Core Power Distribution Calculated From 2 h to 24 h and 24 h Measured Values at 75%FP
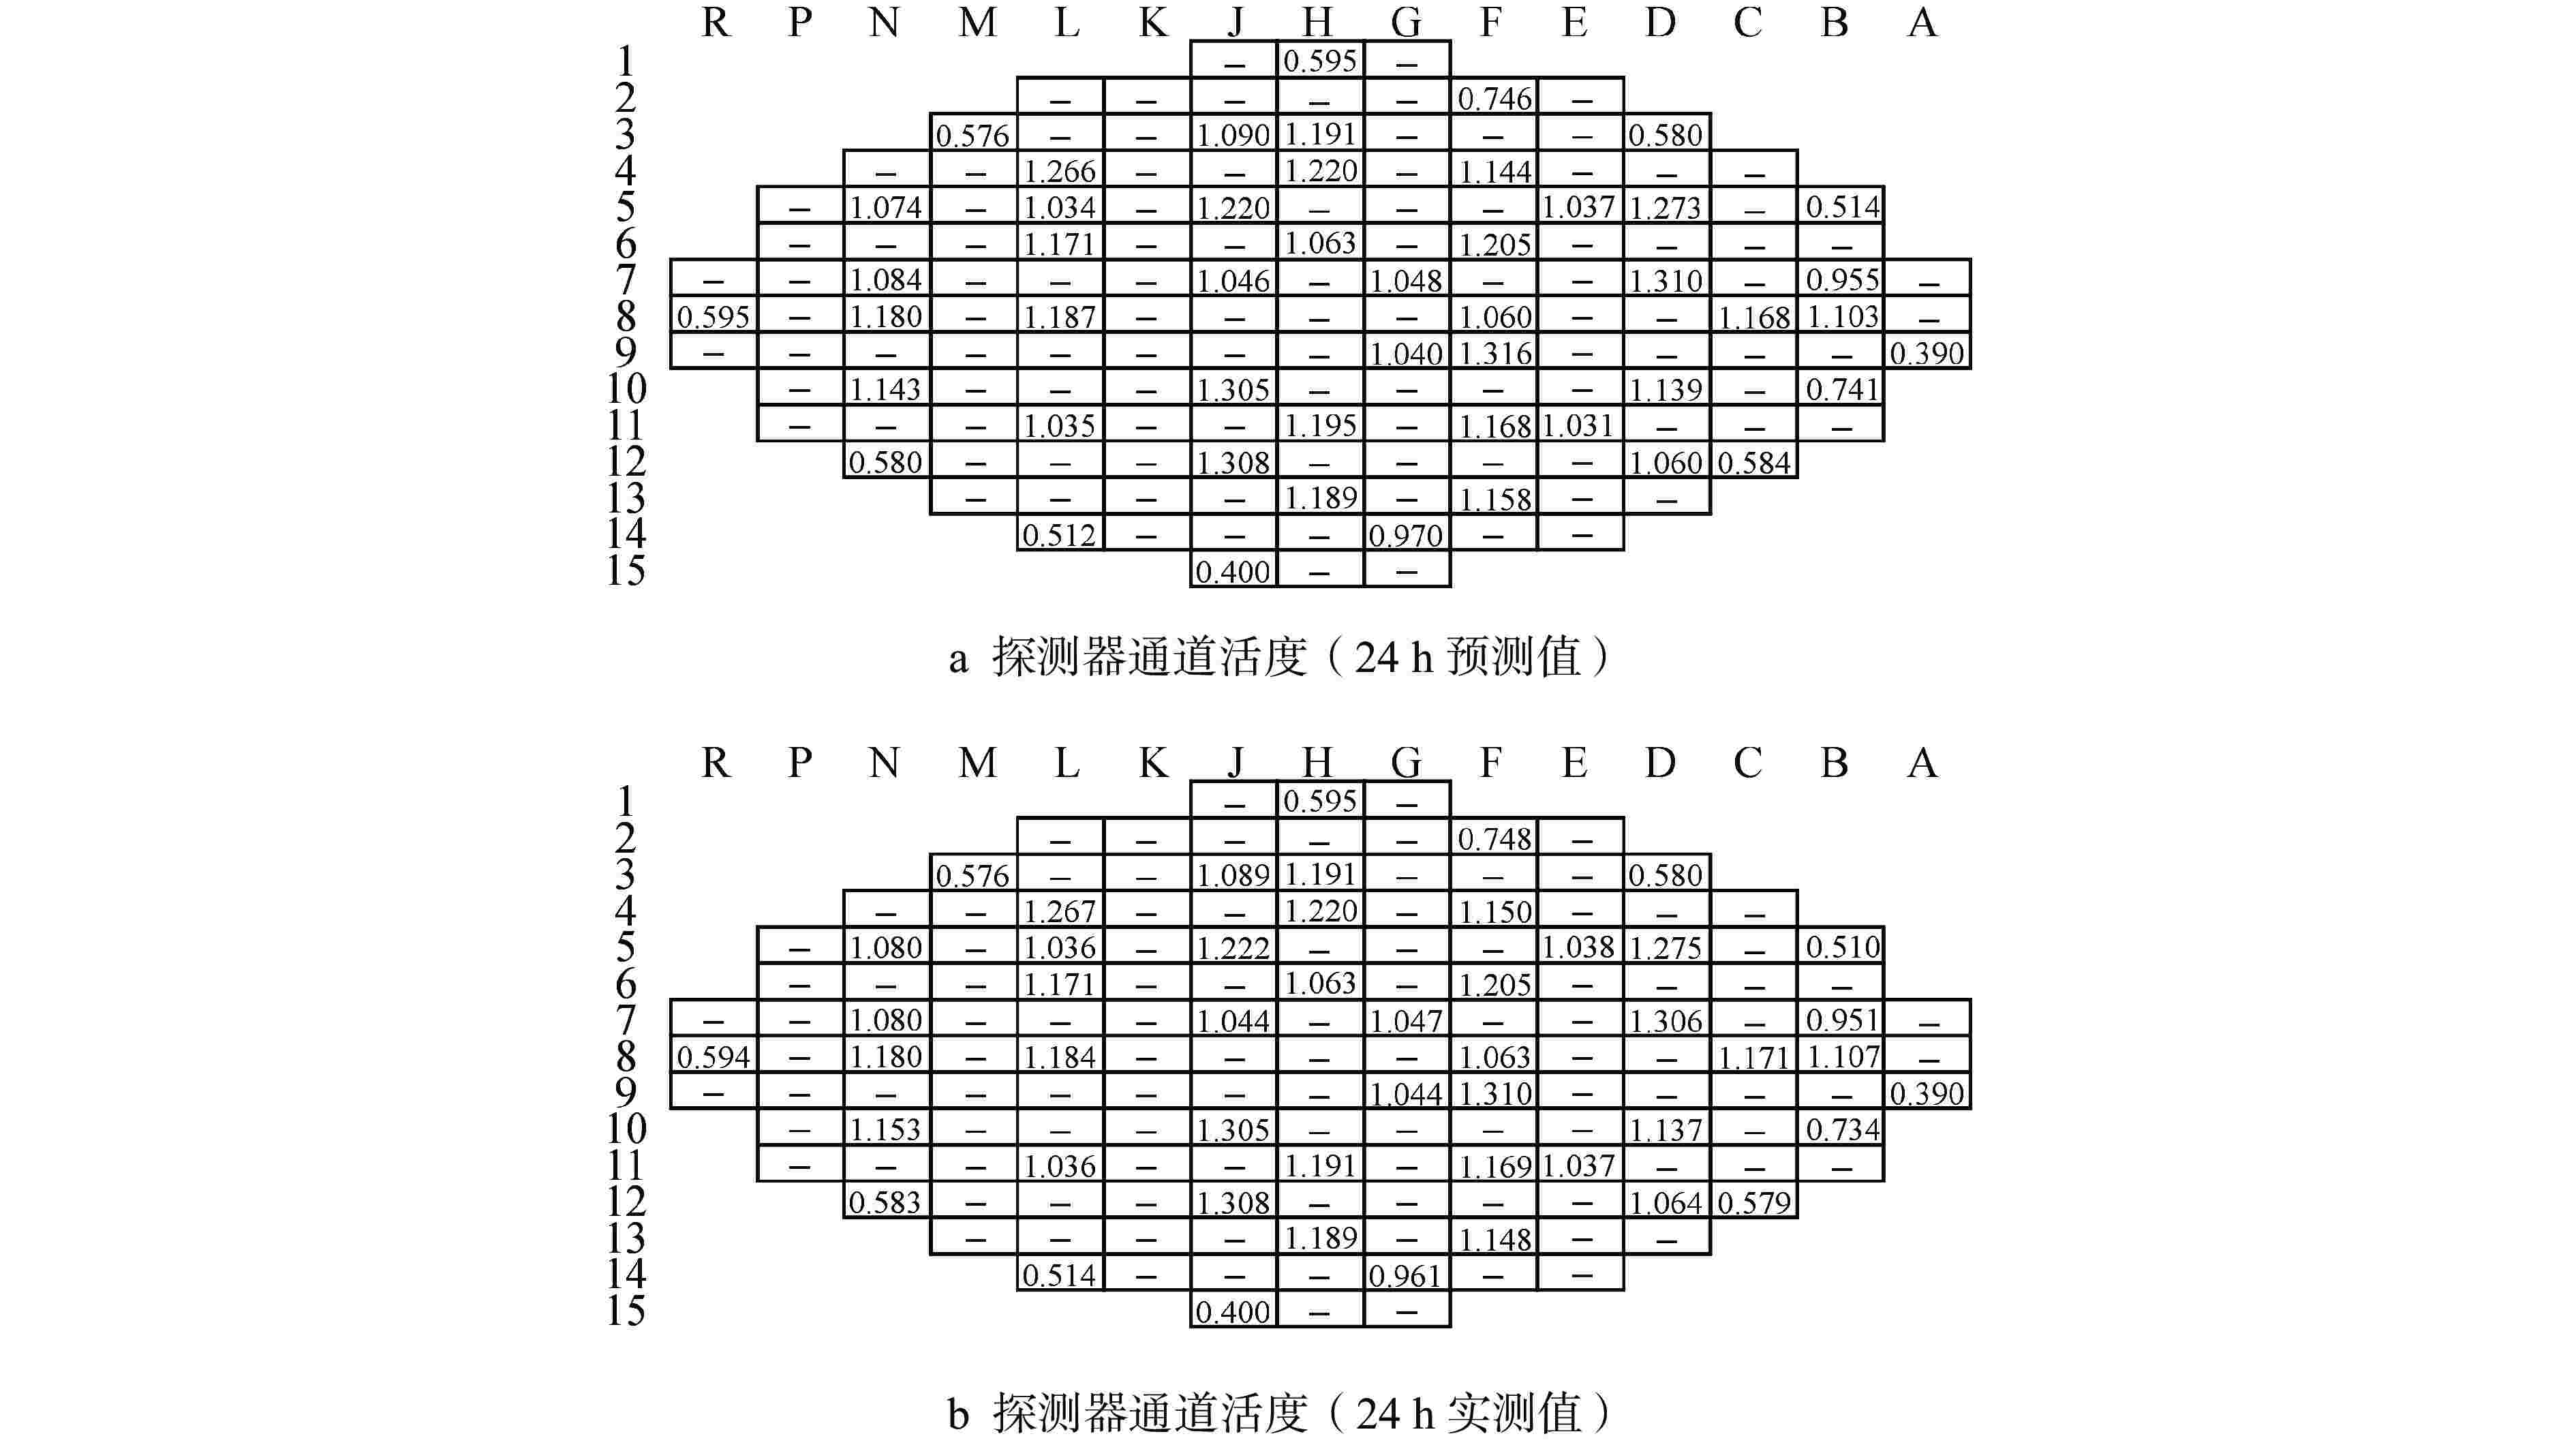
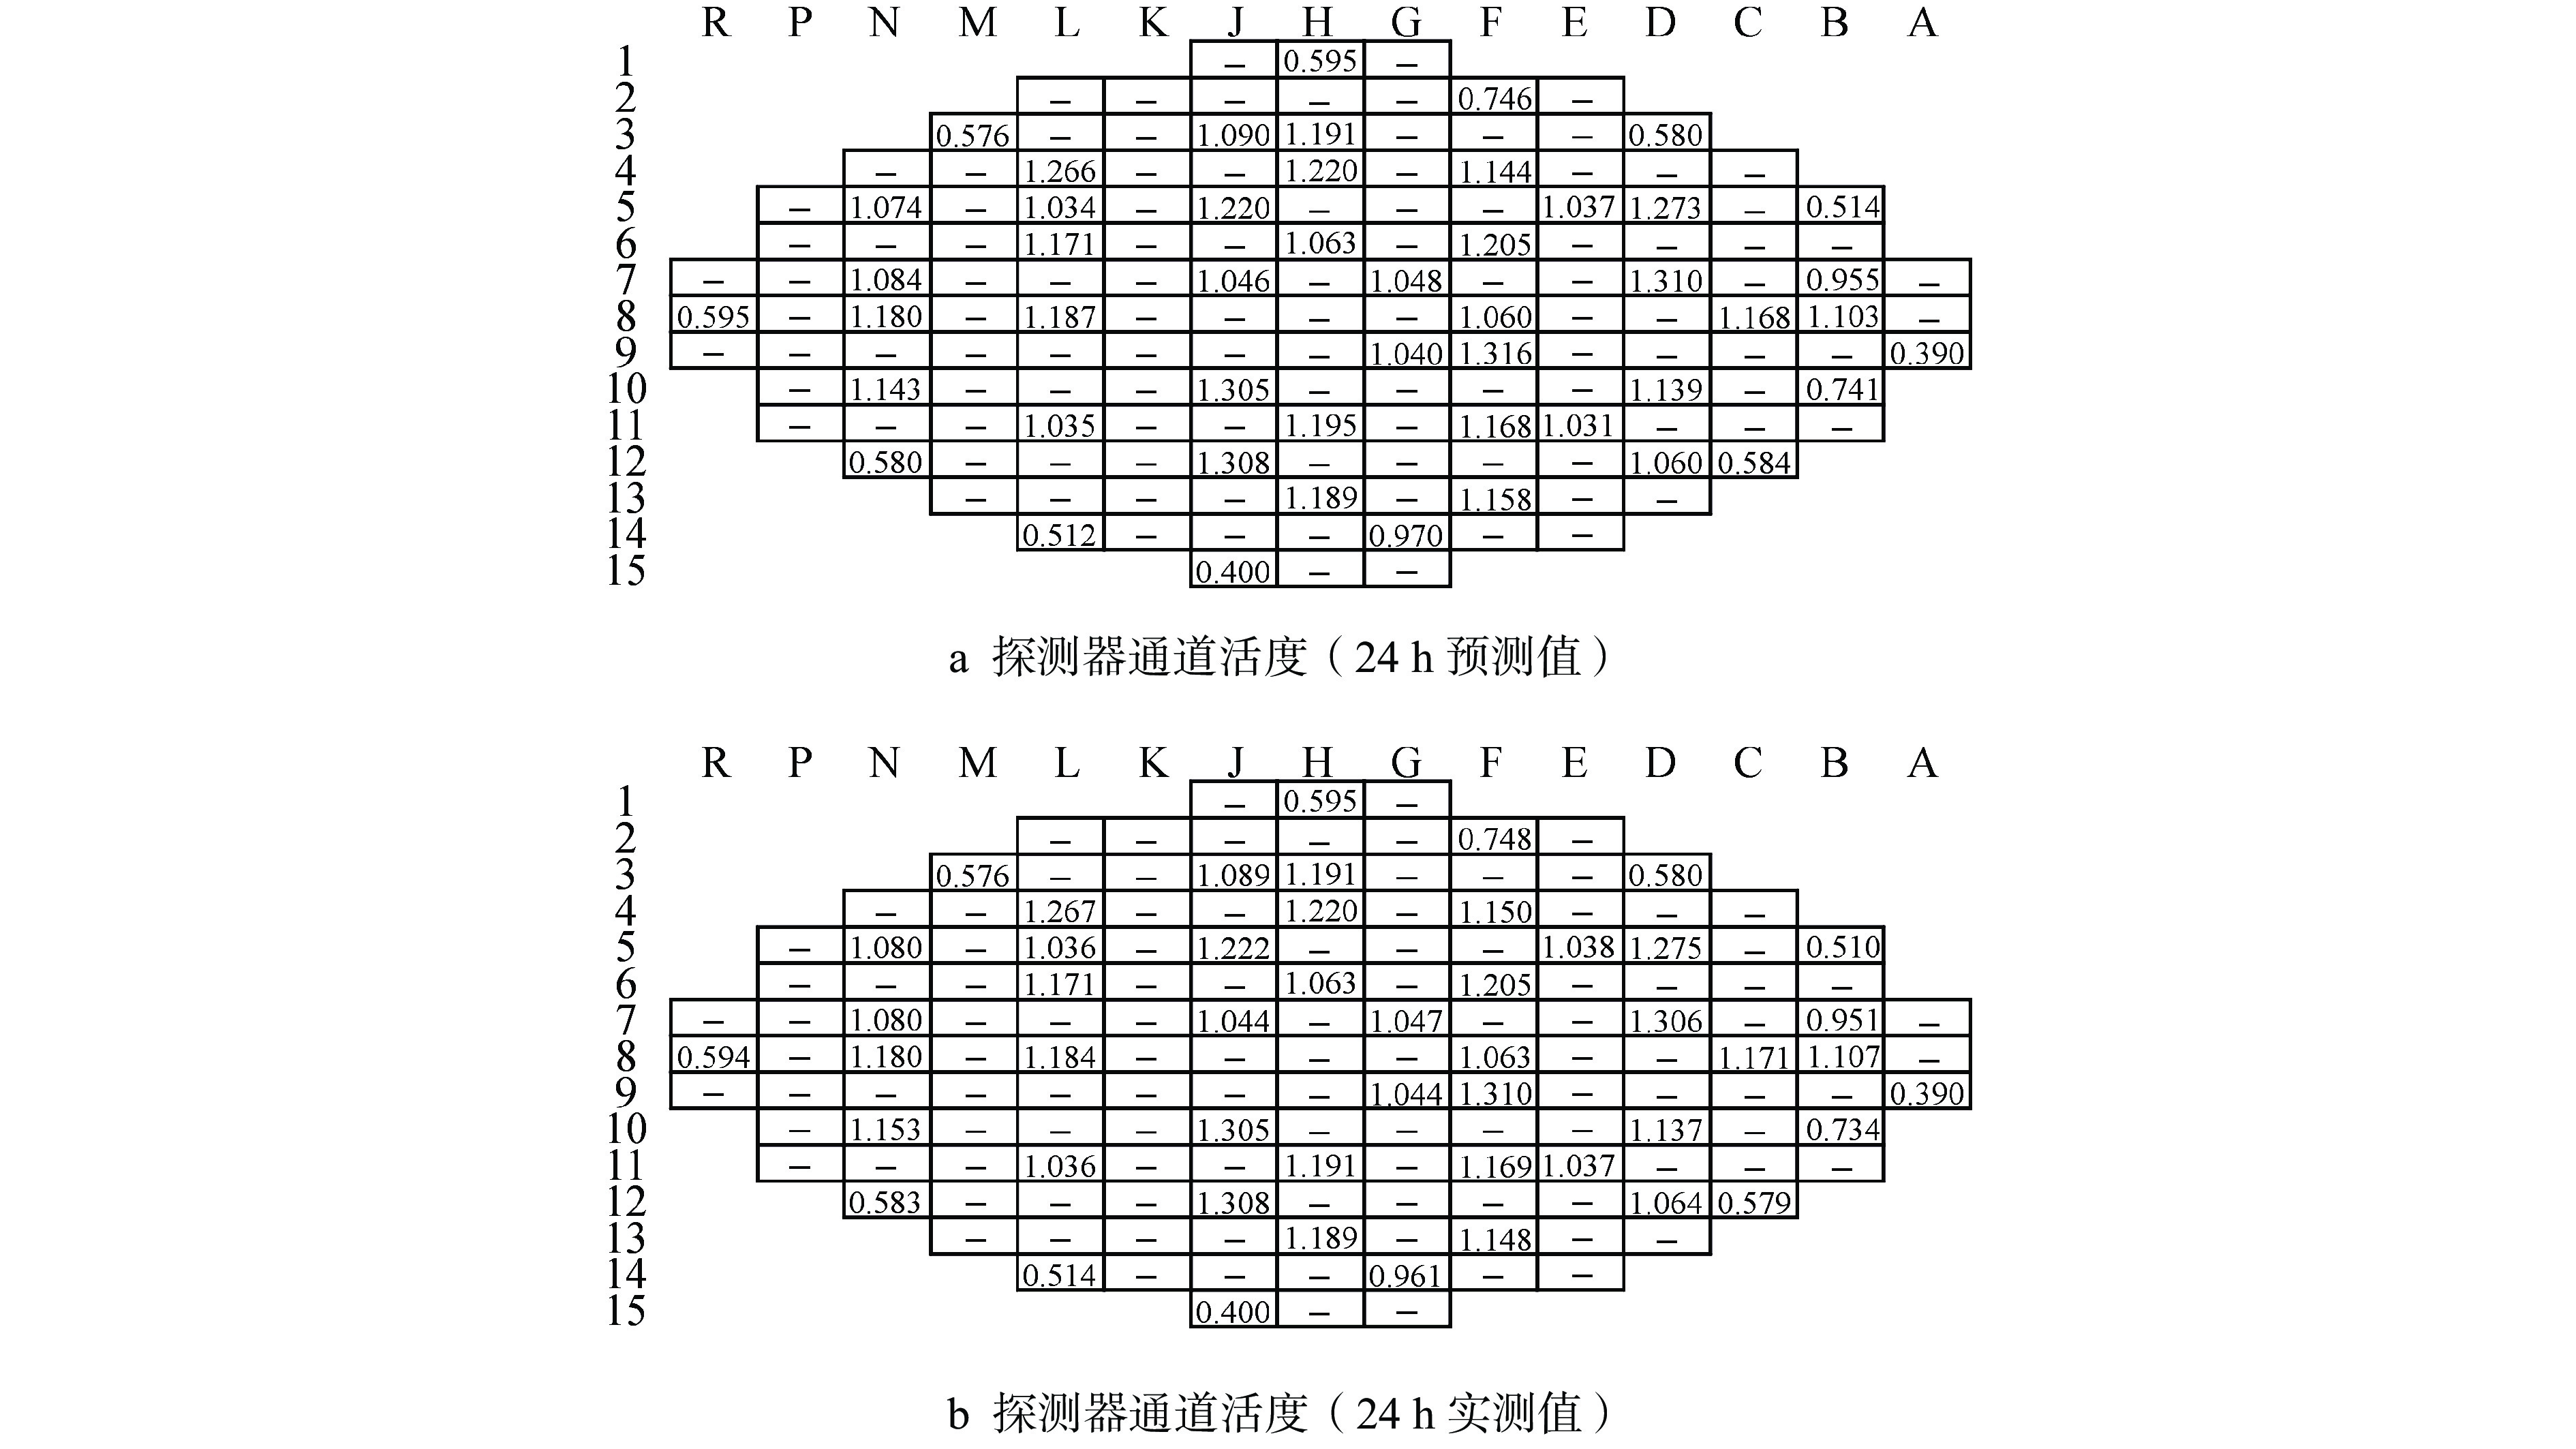
图 3 50个探测器通道活度的预测值与实测值的对比(75%FP)
Figure 3. Comparison of Calculated and Measured Values of 50 Detector Channel Activity at 75%FP

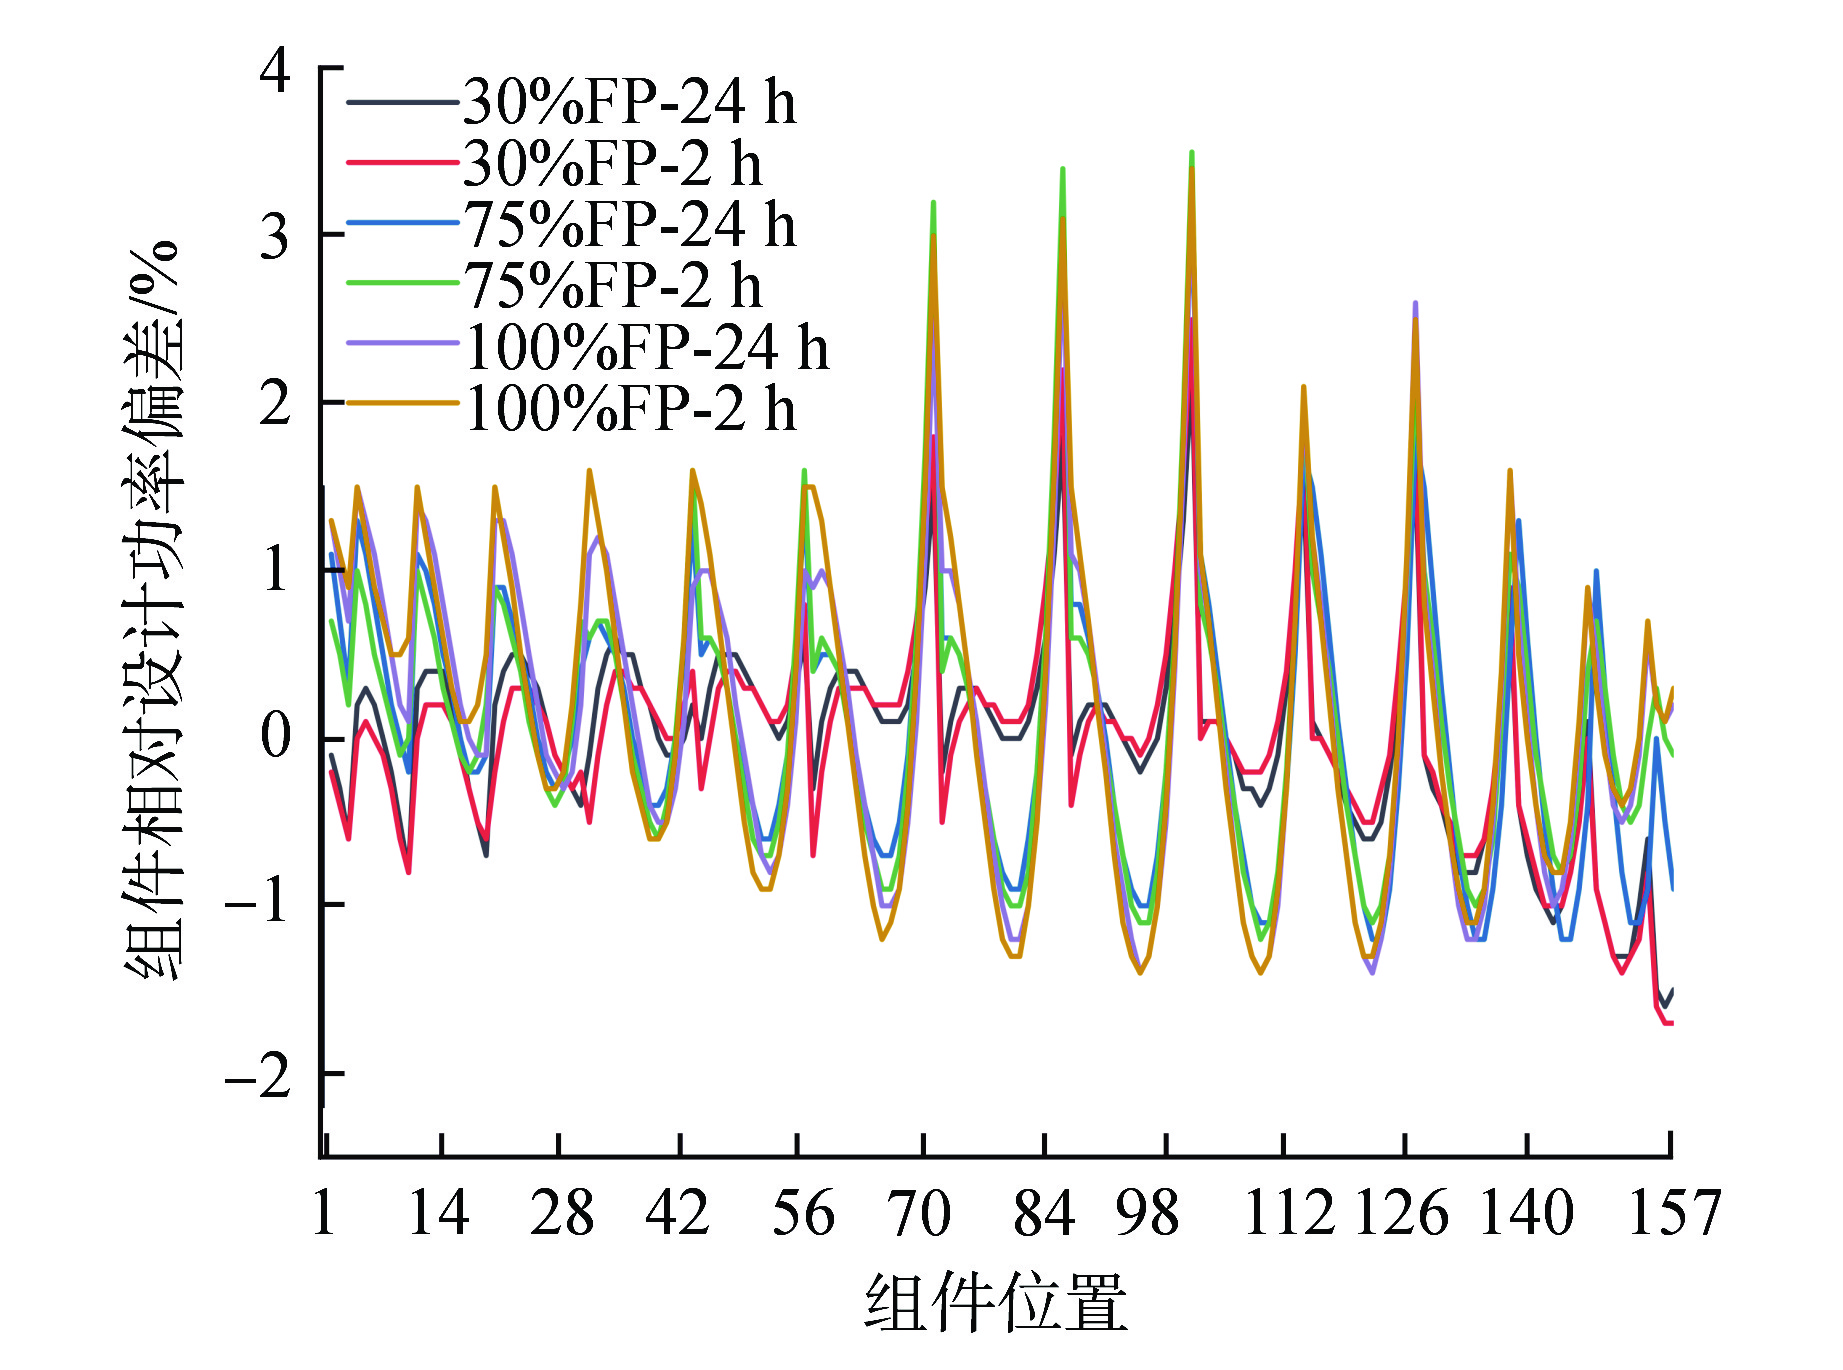
图 4 各功率水平组件相对设计功率偏差对比
图中2 h指稳定2 h预测至24 h的预测值,24 h是指稳定24 h的实测值,图4~图8中类同
Figure 4. Comparison of Relative Design Power Deviation of Elements with Different Power Levels

图 5 各功率水平轴向功率分布对比
Figure 5. Comparison of Axial Power Distribution for Different Power Levels

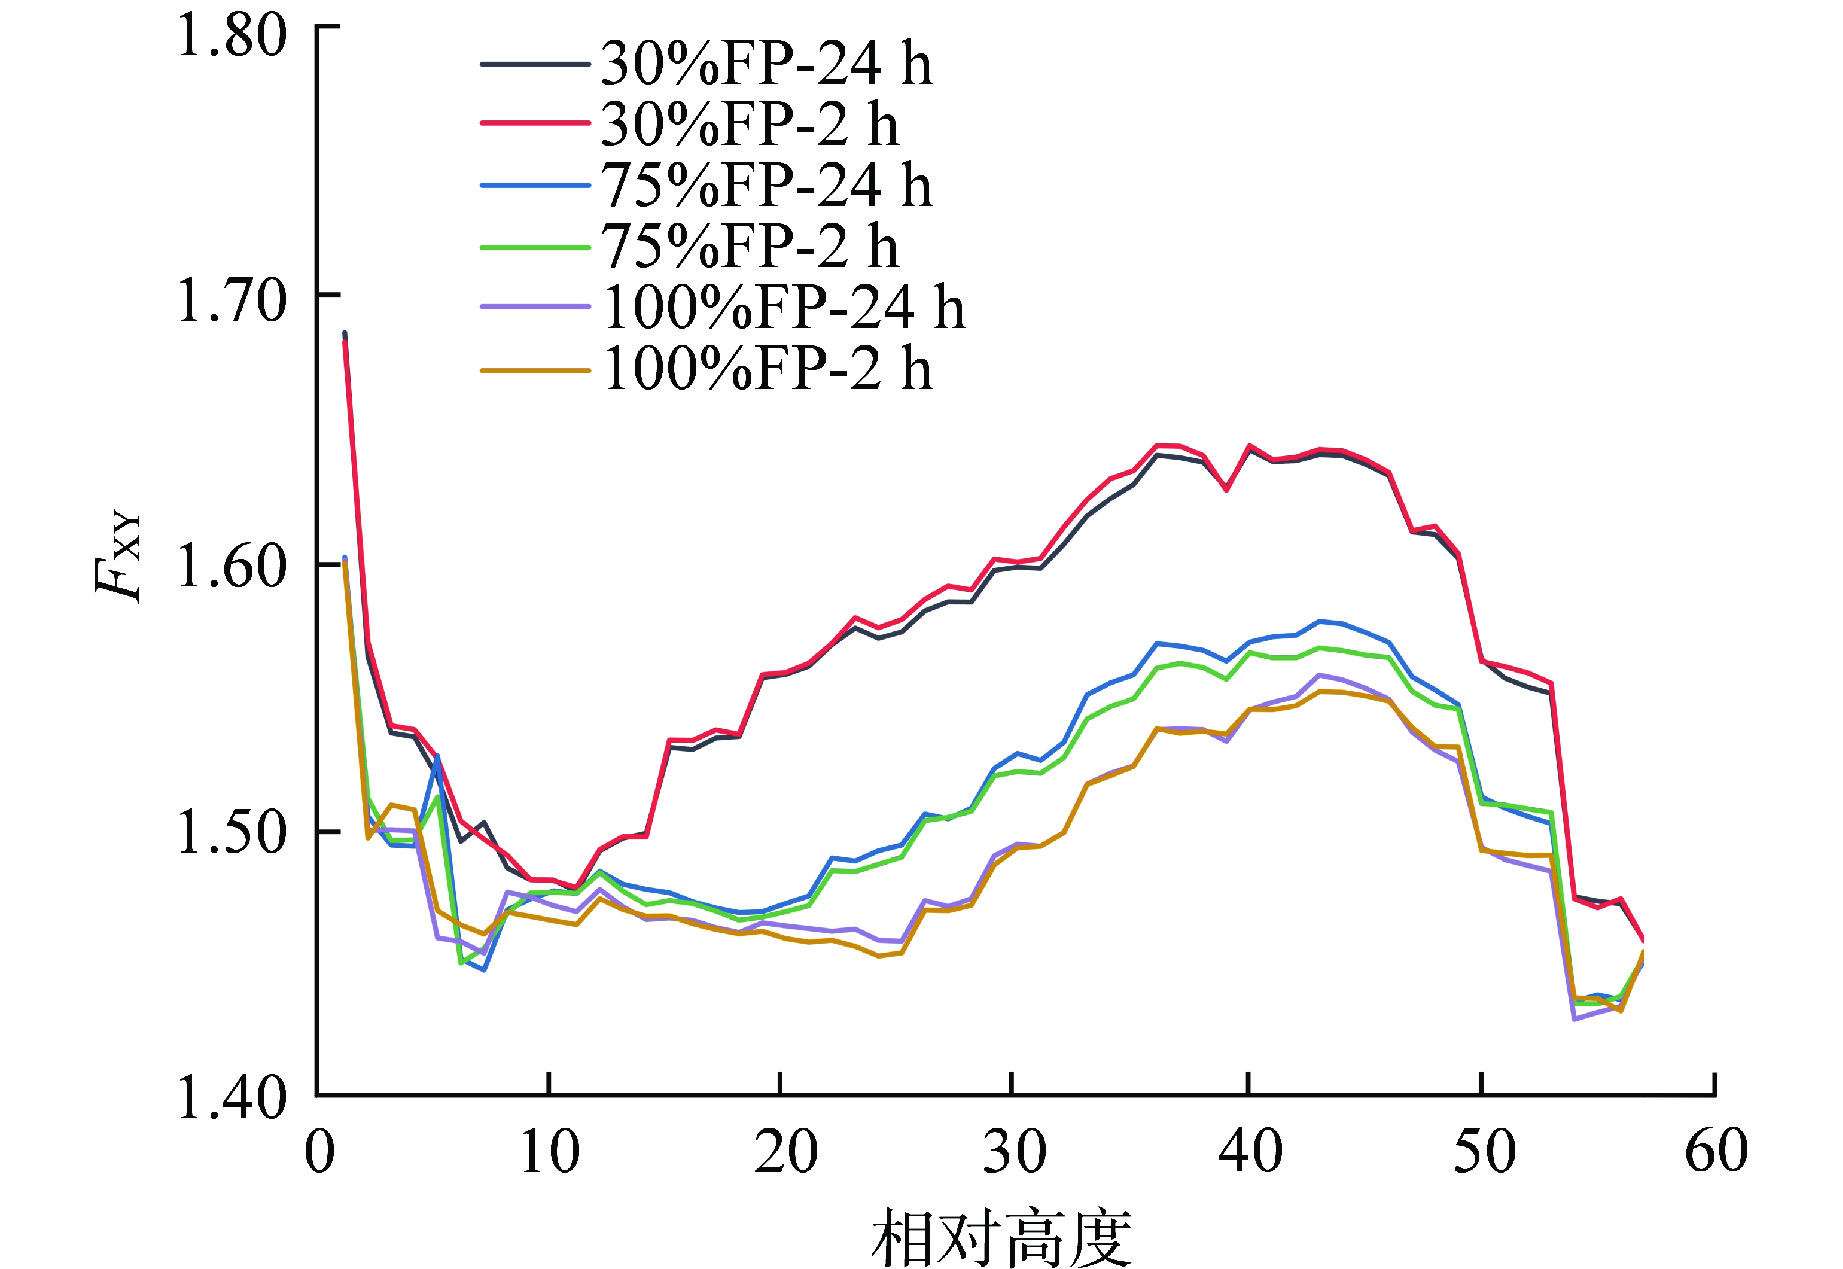
图 6 各功率水平径向功率峰因子对比
Figure 6. Comparison of Radial Power Peak Factor for Different Power Levels
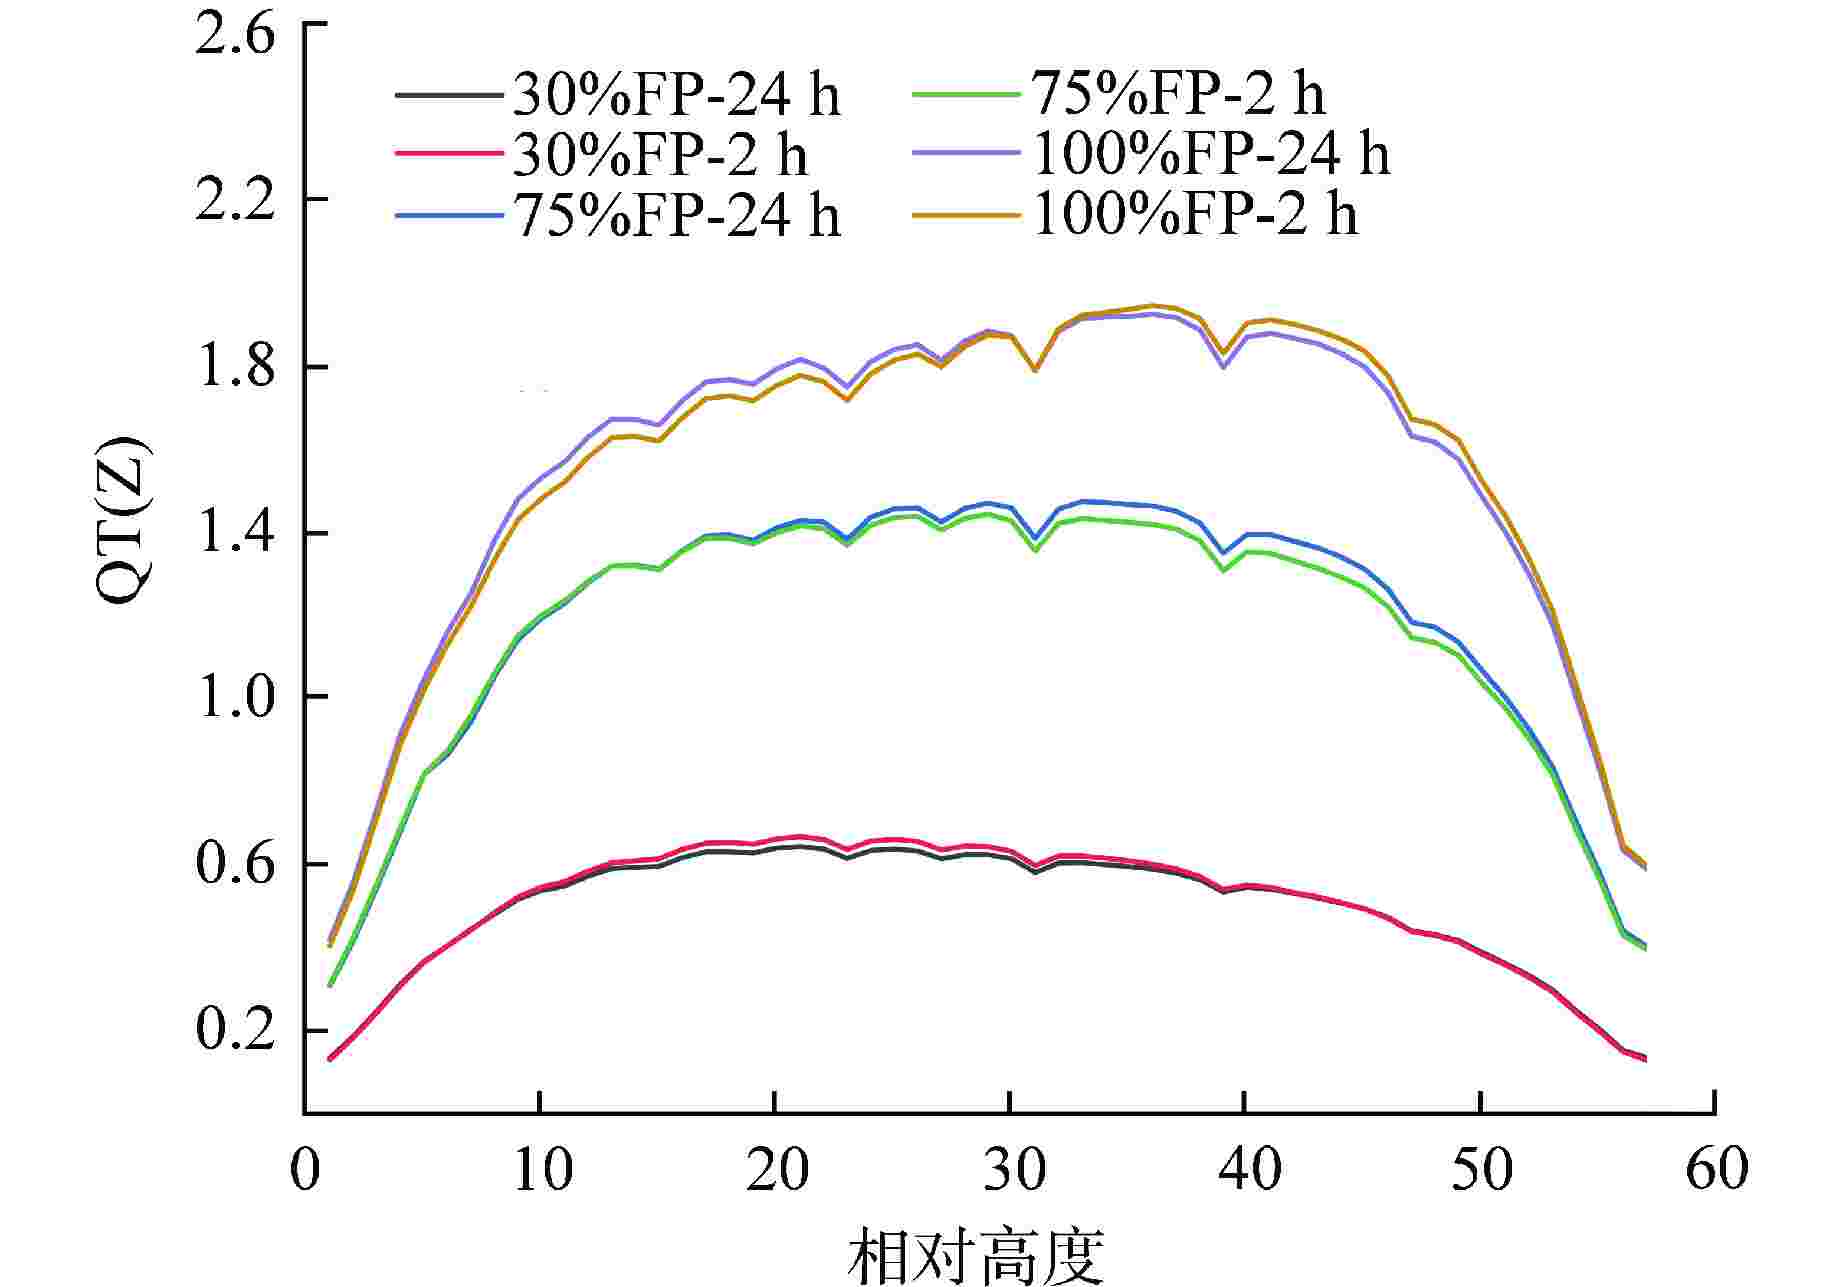
图 7 各功率水平最大线功率密度对比
Figure 7. Comparison of Maximum Linear Power Density for Different Power Levels
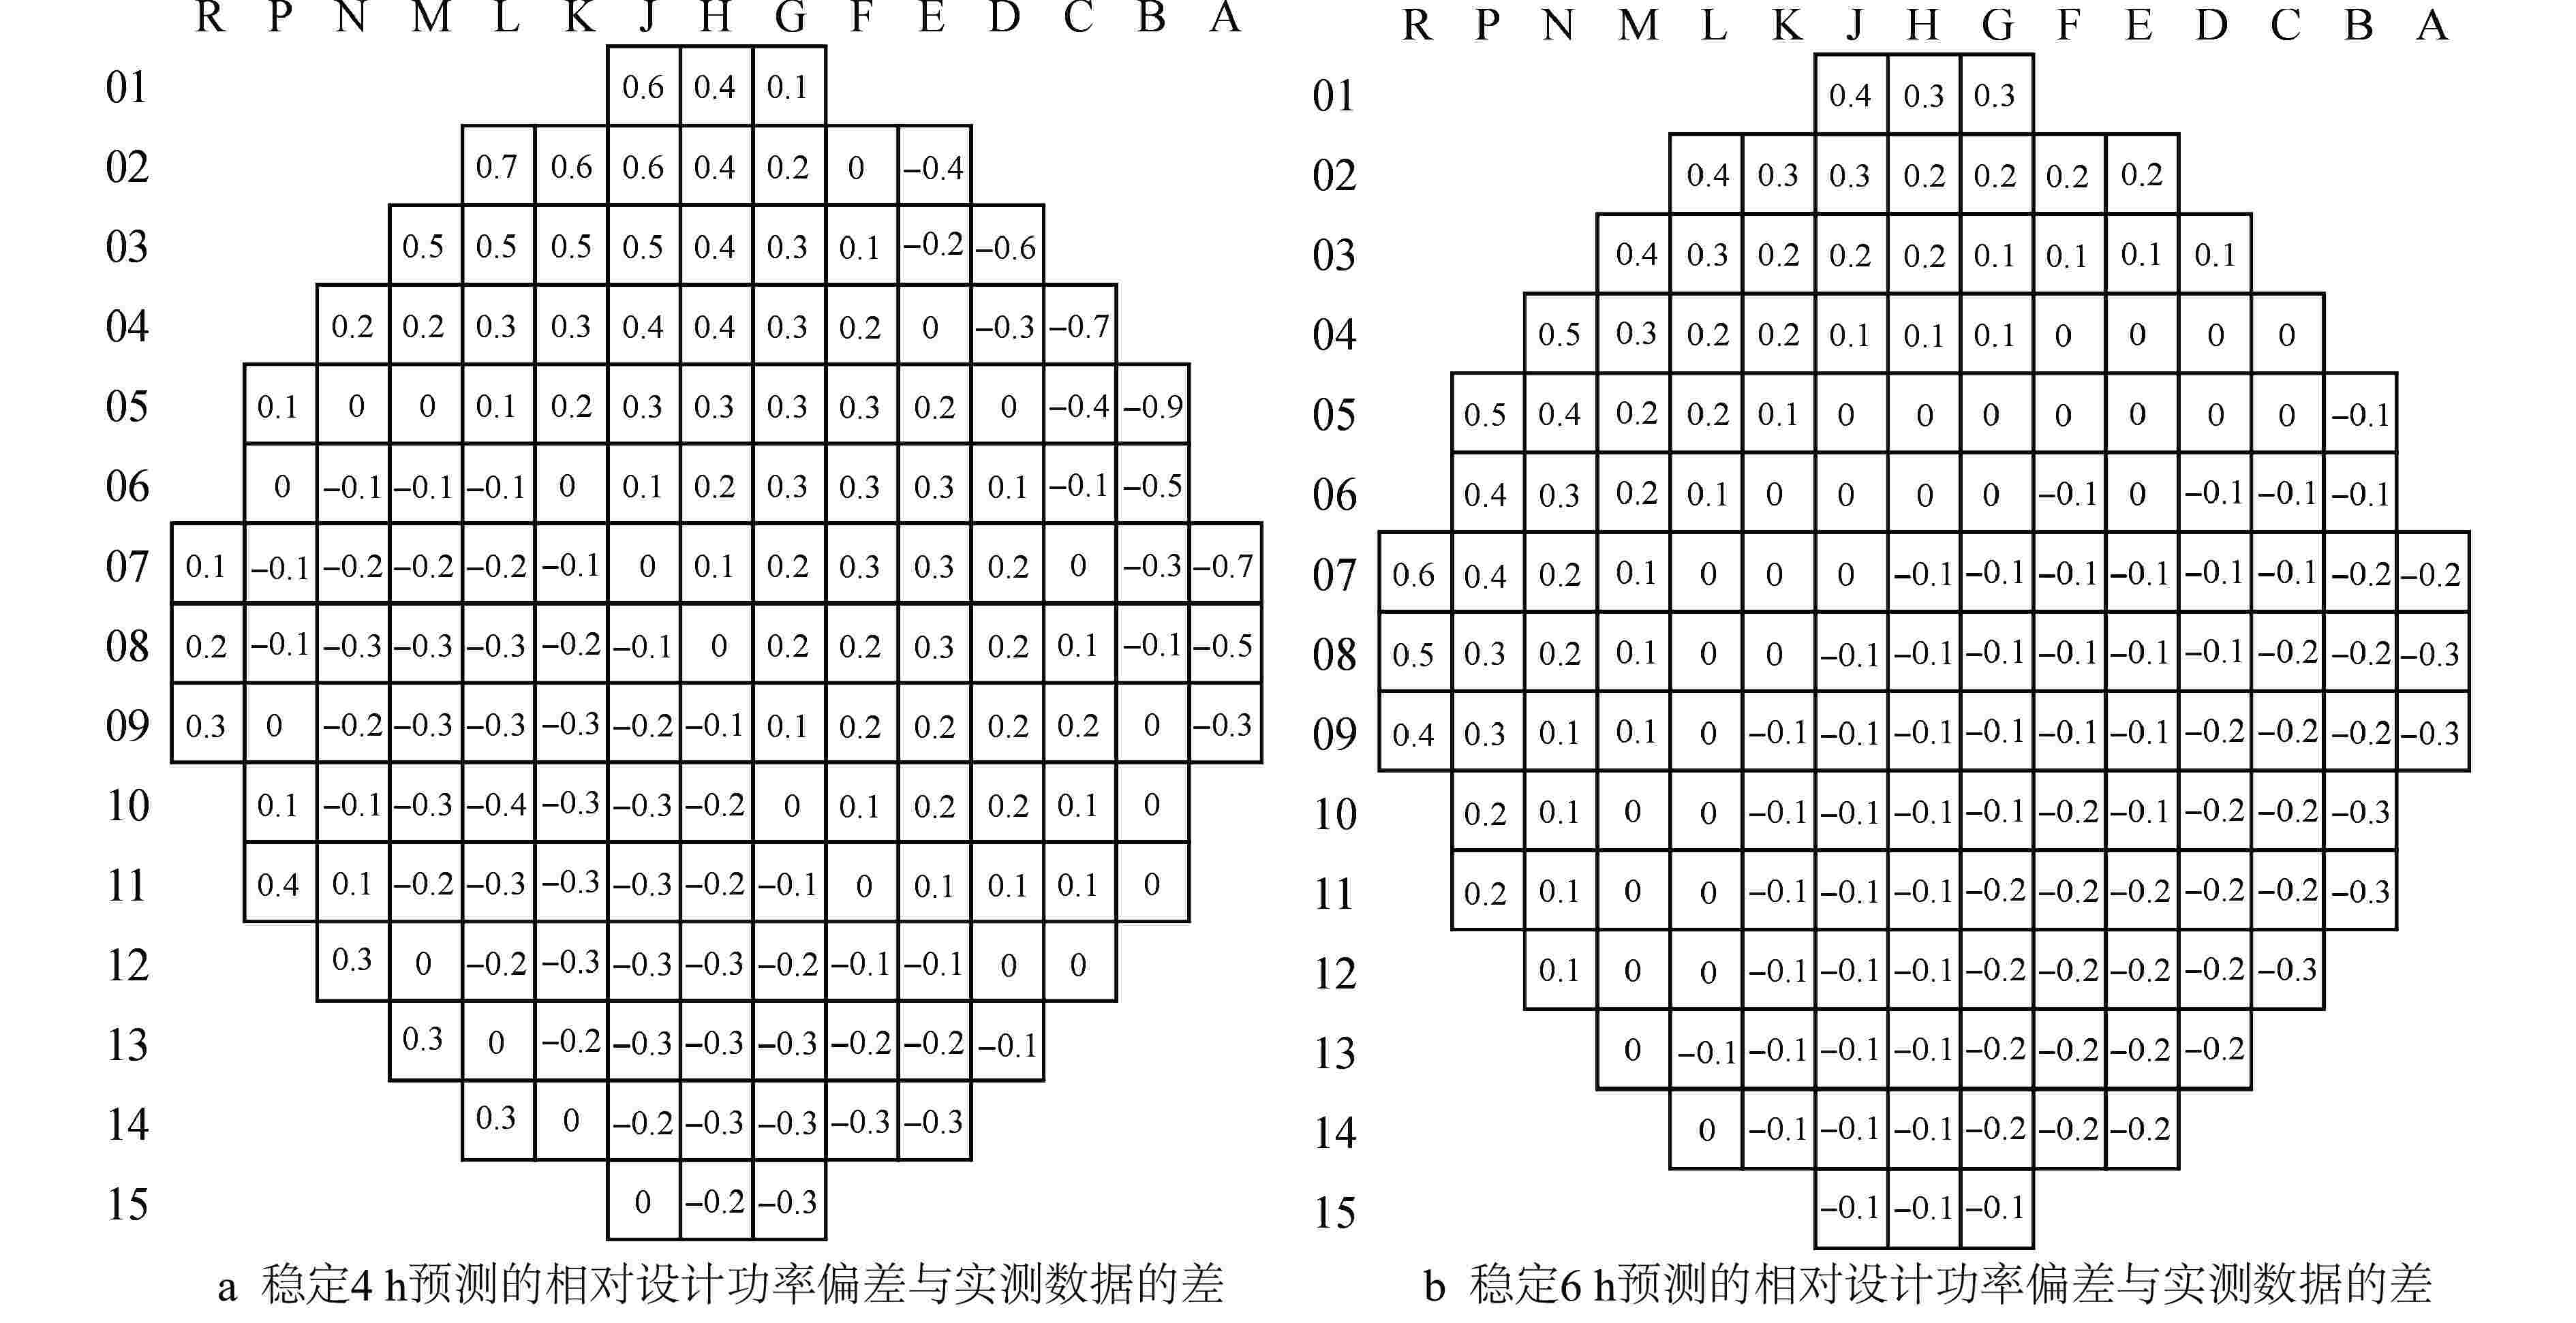
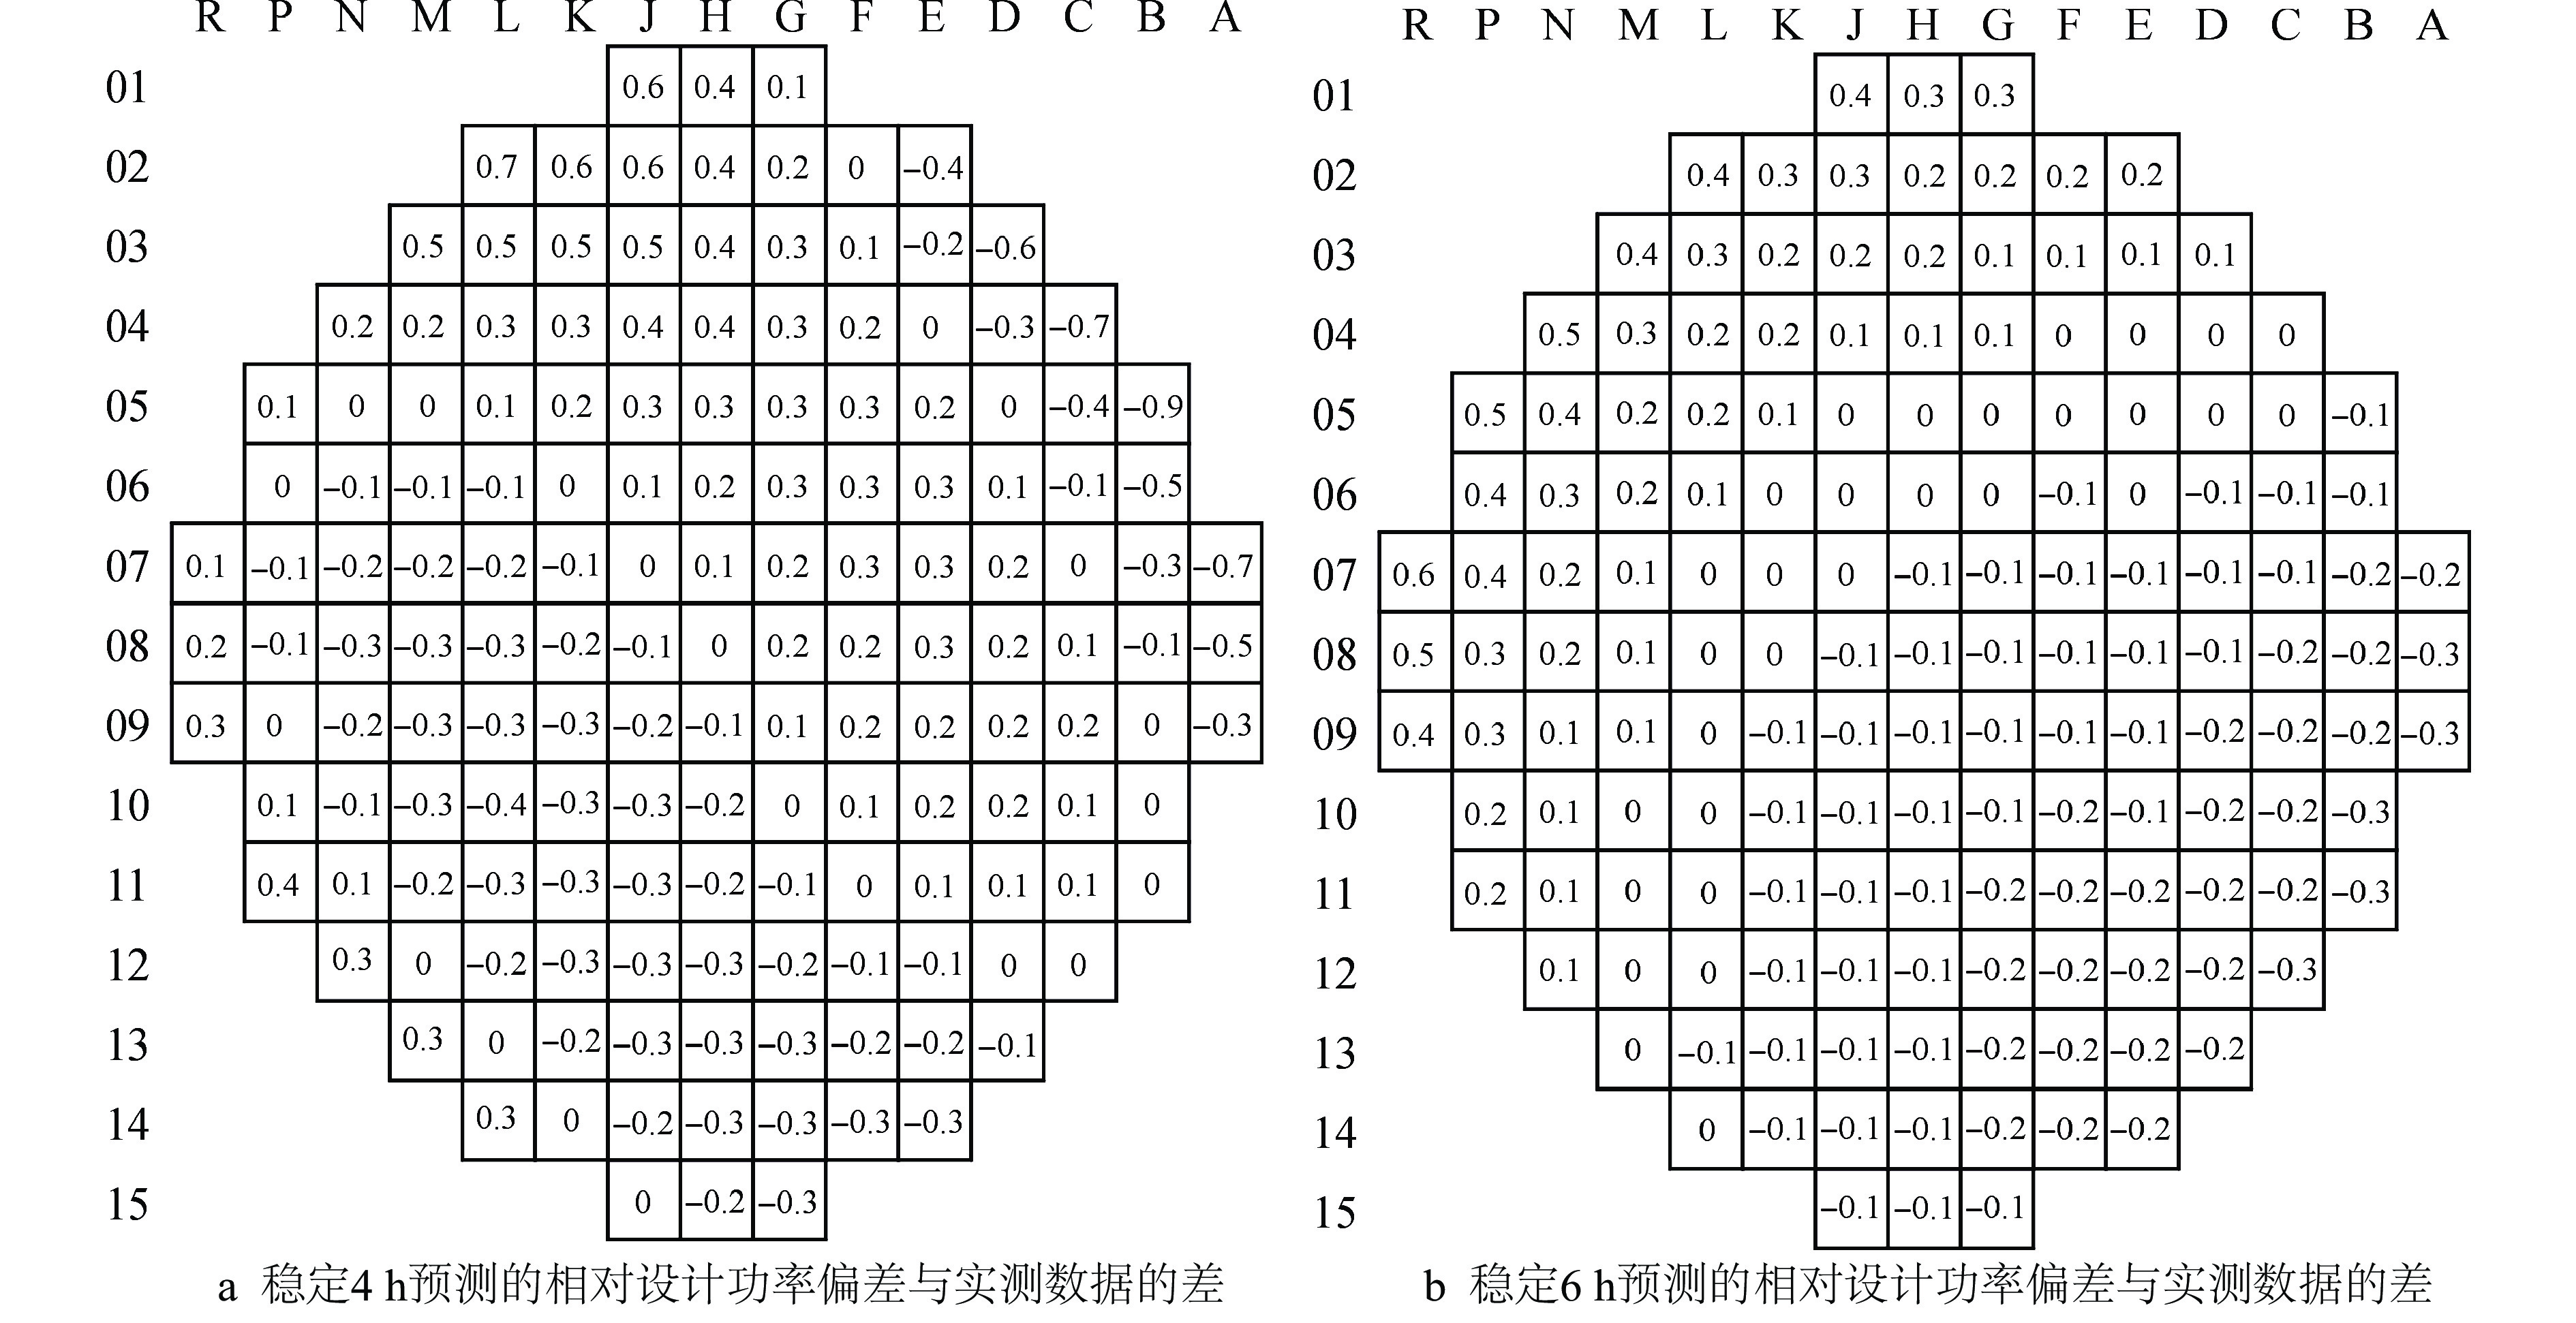
图 8 30%FP功率水平稳定4、6 h预测至稳定24 h堆芯功率分布验证结果
Figure 8. Validation Results of Core Power Distribution Calculated for Stabilization of 4 h and 6 h to 24 h at 30%FP
表 1 U5C1、U5C2启动物理试验CBC/ITC验证结果
Table 1. Validation Results of CBC/ITC during Start-up Physics Test in U5C1 and U5C2
循环 物理量 实测值 计算值 误差 U5C1 CBC/ppm 1197 1201.3 4.3 ITC/(pcm ∙ K−1) −2.84 −2.505 0.335 U5C2 CBC/ppm 1718 1747.6 29.6 ITC/(pcm ∙ K−1) −6.057 −6.233 −0.176  下载: 导出CSV
表 2 U5C1、U5C2启动物理试验控制棒价值验证结果
Table 2. Validation Results of Control Rod Value during Start-up Physics Test in U5C1 and U5C2
循环 控制棒组 实测值/pcm 计算值/pcm 绝对误差/pcm 相对误差/% U5C1 R 1067 1100.14 33.14 3.0 G1 315 297.92 −17.08 −5.4 G2 894 875.87 −18.13 −2.0 N1 1037 1040.32 3.32 0.3 N2 891 919.83 28.83 3.2 SA 619 619.26 0.26 0.0 SB 1212 1191.93 −20.07 −1.7 SC 663 627.02 −35.98 −5.4 SD 607 578.20 −28.80 −4.7 U5C2 R 1250 1213.21 −36.79 −2.9 G1 330 352.70 22.70 6.9 G2 606 627.58 21.58 3.6 N1 884 873.34 −10.66 −1.2 N2 599 601.24 2.24 0.4 SA 472 469.66 −2.34 −0.5 SB 1110 1166.62 56.62 5.1 SC 480 501.25 21.25 4.4 SD 671 690.02 19.02 2.8 R—温度调节棒组;G1/G2/N1/N2—功率补偿棒组;SA/SB/SC/SD—停堆棒组
下载: 导出CSV
表 3 各功率水平预测结果与验收准则比较
Table 3. Comparison of Maximum Calculation Results and Acceptance Criteria at Different Power Levels
相对功率
水平/%稳定时
间/h燃料组件相对功率偏差 FΔH FXY 相对功率≥0.9 相对功率<0.9 相对偏差/% 验收准则/% 相对偏差/% 验收准则/% 最大FΔH 验收准则① FXY 验收准则 30 2 1.6 ≤10 2.5 ≤15 1.5099 1.6438 <1.7968 4 1.4 2.5 1.5037 1.6394 6 1.6 2.5 1.5069 1.6389 24 1.3 2.2 1.5071 1.6419 75 2 1.9 ≤5 3.5 ≤8 1.4578 <1.7136 1.5693 <1.6550 4 1.9 3.6 1.4583 1.5779 6 1.7 3.4 1.4559 1.5704 24 1.7 3.2 1.4643 1.5793 100 2 1.8 ≤5 3.5 ≤8 1.4545 <1.5983 1.5530 <1.6160 4 1.7 3.5 1.4564 1.5521 6 1.7 3.4 1.4557 1.5565 24 1.6 3.3 1.4564 1.5591 ①根据设计文件,在30%FP平台FΔH无验收准则
下载: 导出CSV
-
[1] 沈聪. 320MWe核电机组75%功率平台试验前稳定时间优化[J]. 科技视界,2018(1):7-10. doi: 10.3969/j.issn.2095-2457.2018.01.003 [2] 杨庆湘,王丽华,姜赫,等. 压水堆核电厂换料物理启动试验优化研究和应用实践[J]. 核科学与工程,2016,36(5):617-623. doi: 10.3969/j.issn.0258-0918.2016.05.007 [3] 郭建,曹云龙. 北方某核电厂升功率物理试验优化的论证及实施[J]. 核科学与工程,2017,37(3):514-519. doi: 10.3969/j.issn.0258-0918.2017.03.027 [4] 胡娟,李振振,孟凡锋. M310机组堆芯功率分布试验Fxy验收准则分析[J]. 商品与质量,2018(50):164-166. doi: 10.3969/j.issn.1006-656X.2018.50.154 [5] 詹勇杰. 秦山第二核电厂物理启动试验优化探讨[D]. 上海:上海交通大学,2008. [6] LEE K, KIM C H. The least-squares method for three-dimensional core power distribution monitoring in pressurized water reactors[J]. Nuclear Science And Engineering, 2003, 143(3): 268-280. doi: 10.13182/NSE03-A2335 [7] RAMEZANI I, GHOFRANI M B. Reconstruction of neutron flux distribution by nodal synthesis method using online in-core neutron detector readings[J]. Progress in Nuclear Energy, 2021, 131: 103574. doi: 10.1016/j.pnucene.2020.103574 [8] 万承辉,李云召,郑友琦,等. 压水堆燃料管理软件Bamboo-C研发及工业确认[J]. 核动力工程,2021,42(5):15-22. doi: 10.13832/j.jnpe.2021.05.0015 -

 下载:
下载:


计量
- 文章访问数: 457
- HTML全文浏览量: 132
- PDF下载量: 89
- 被引次数: 0
