


Calculation Method of Pseudo-critical Line Based on Different State Equations and Division of Pseudo-critical Zone
-
摘要: 超临界流体在拟临界区内物性会发生剧烈变化。为建立拟临界区的划分方式,本文以超临界二氧化碳为研究对象,首先基于Van der Waals 、Redlich-Kwong和Soave-Redlich-Kwong3个不同精度的状态方程分别计算获得了对应的拟临界线;然后基于连续相变理论,通过Ehrenfest方程确定了拟临界区;最后根据拟临界区划分结果,与传热退化发生的区域进行匹配,分析了不同区域内影响传热退化行为的内在机制。结果表明浮生力效应在拟临界区前和拟临界区之内对传热恶化起主导作用,流动加速效应在拟临界区之后起主导作用。Abstract: Supercritical fluids undergo drastic changes in thermophysical properties within the pseudo-critical zone. In order to establish the division mode of Pseudo-critical zone, this paper takes supercritical carbon dioxide as the research object. First, the corresponding Pseudo-critical lines are obtained based on three state equations with different accuracy. Then, based on the theory of continuous phase transition, the Pseudo-critical zone is determined by Ehrenfest equation. Finally, according to the division results of the Pseudo-critical zone, matching with the zone where the heat transfer degradation occurs, the internal mechanism affecting the heat transfer degradation behavior in different regions is analyzed.
-
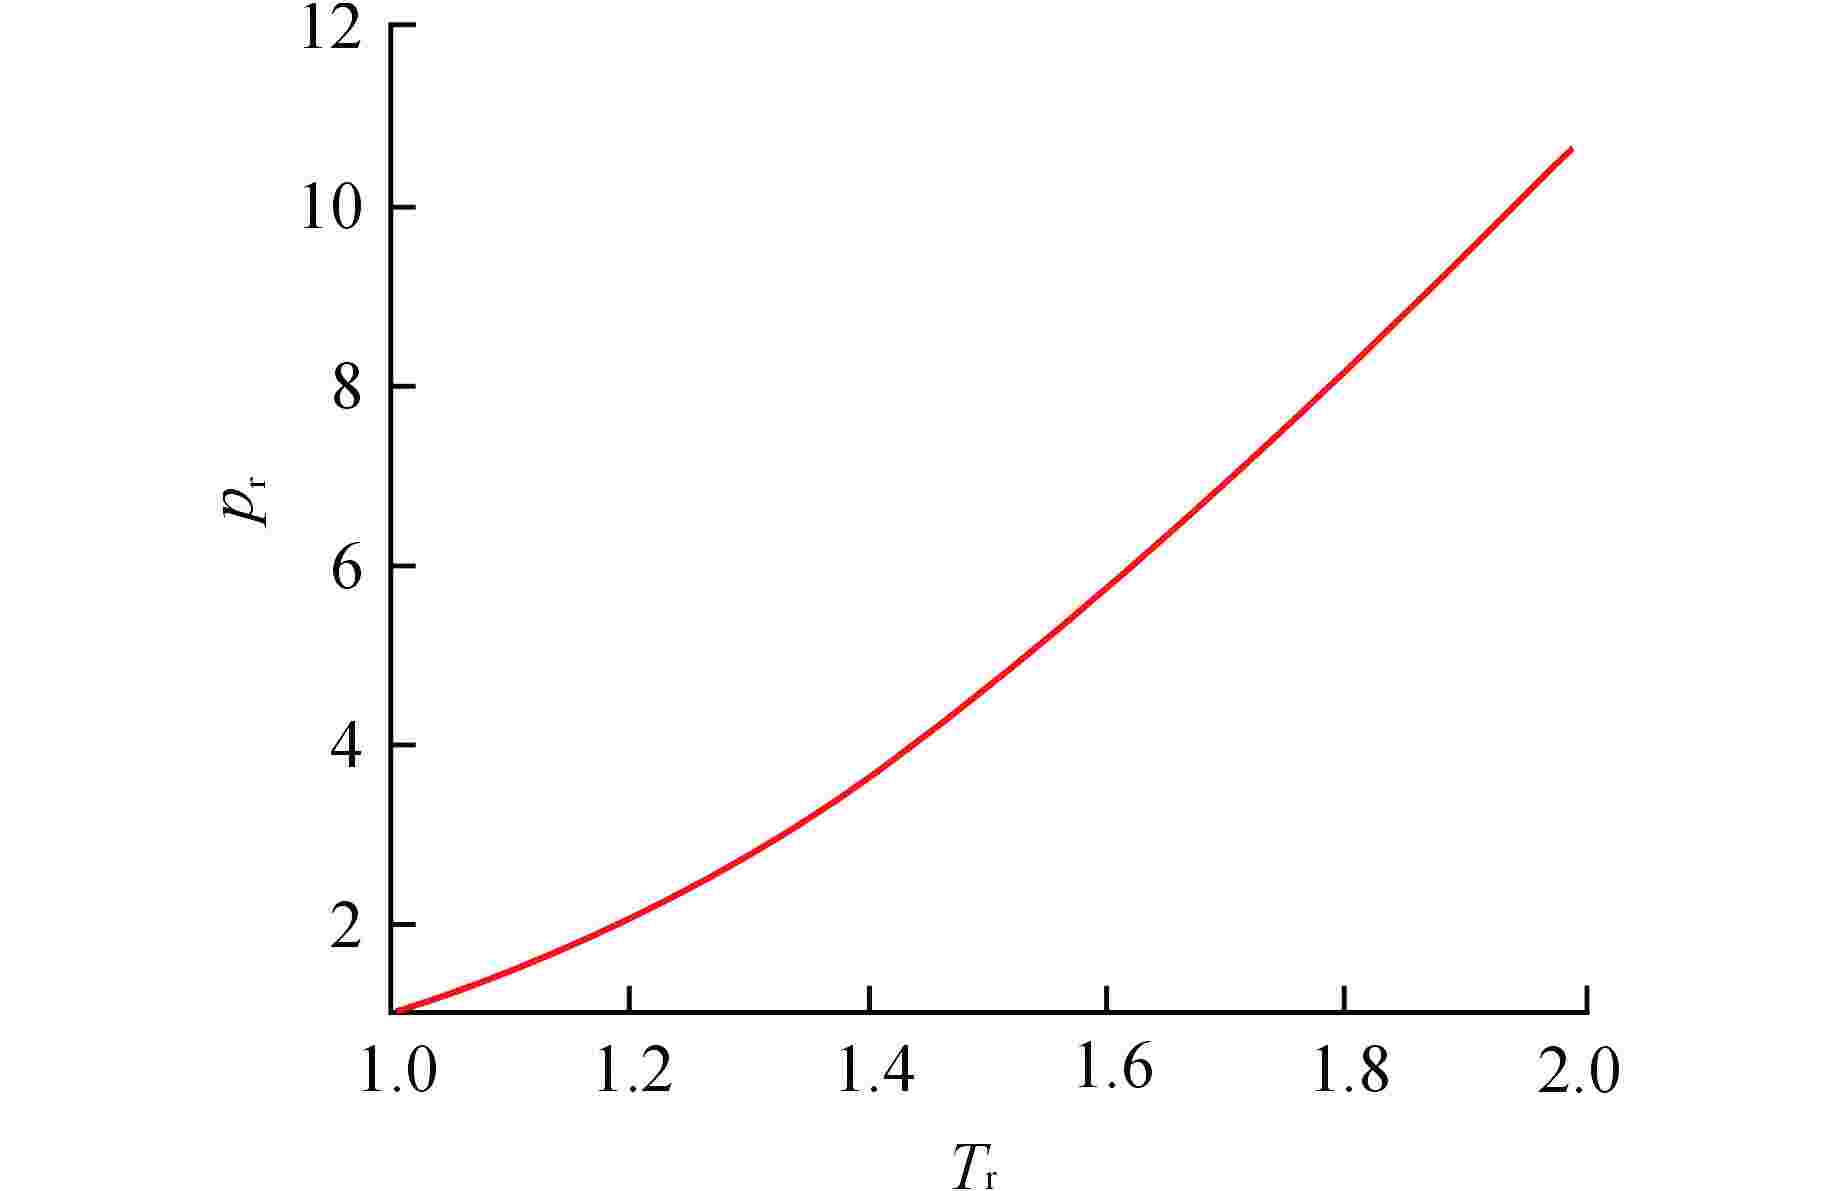
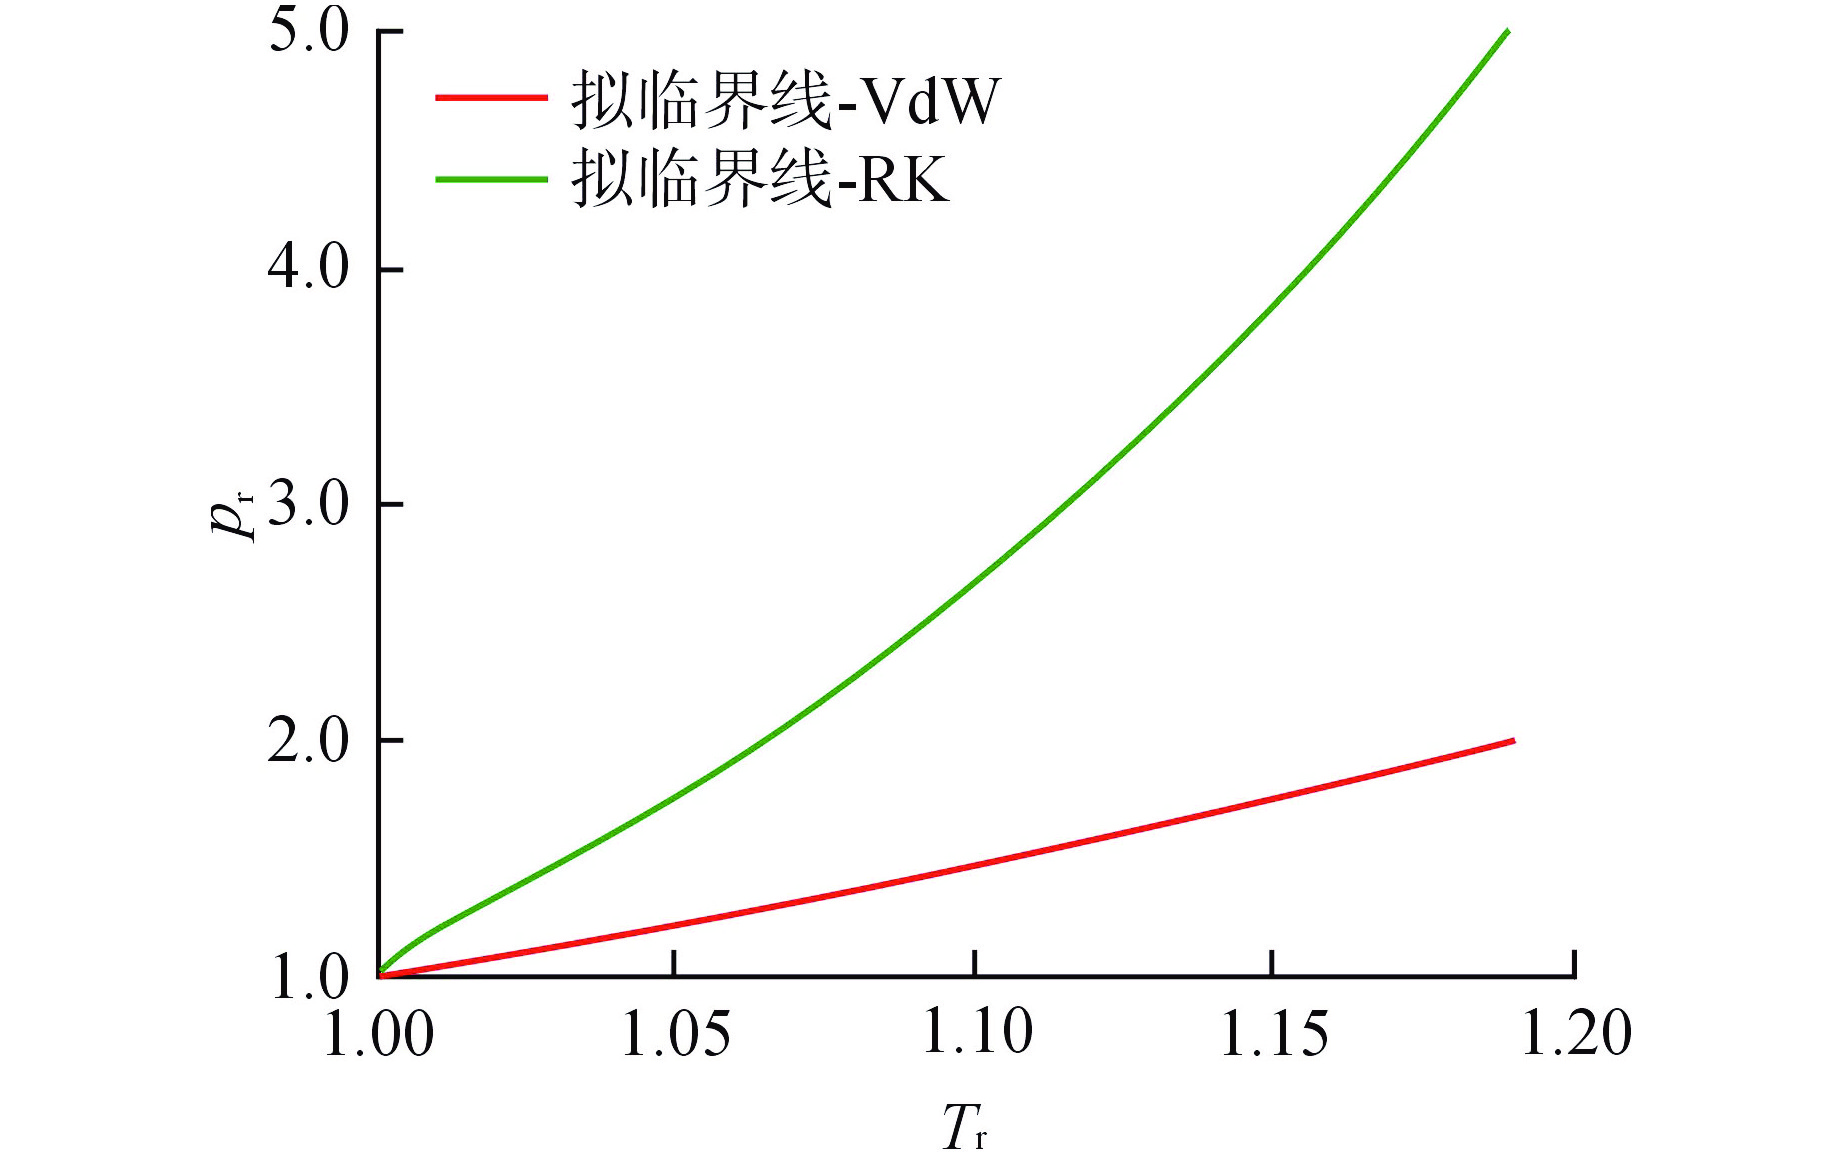
图 1 基于VdW方程的超临界二氧化碳拟临界线
Figure 1. Supercritical CO2 Pseudo-critical Line Based on VdW Equation

图 2 基于RK方程的超临界二氧化碳拟临界线
Figure 2. Supercritical CO2 Pseudo-critical Line Based on RK Equation
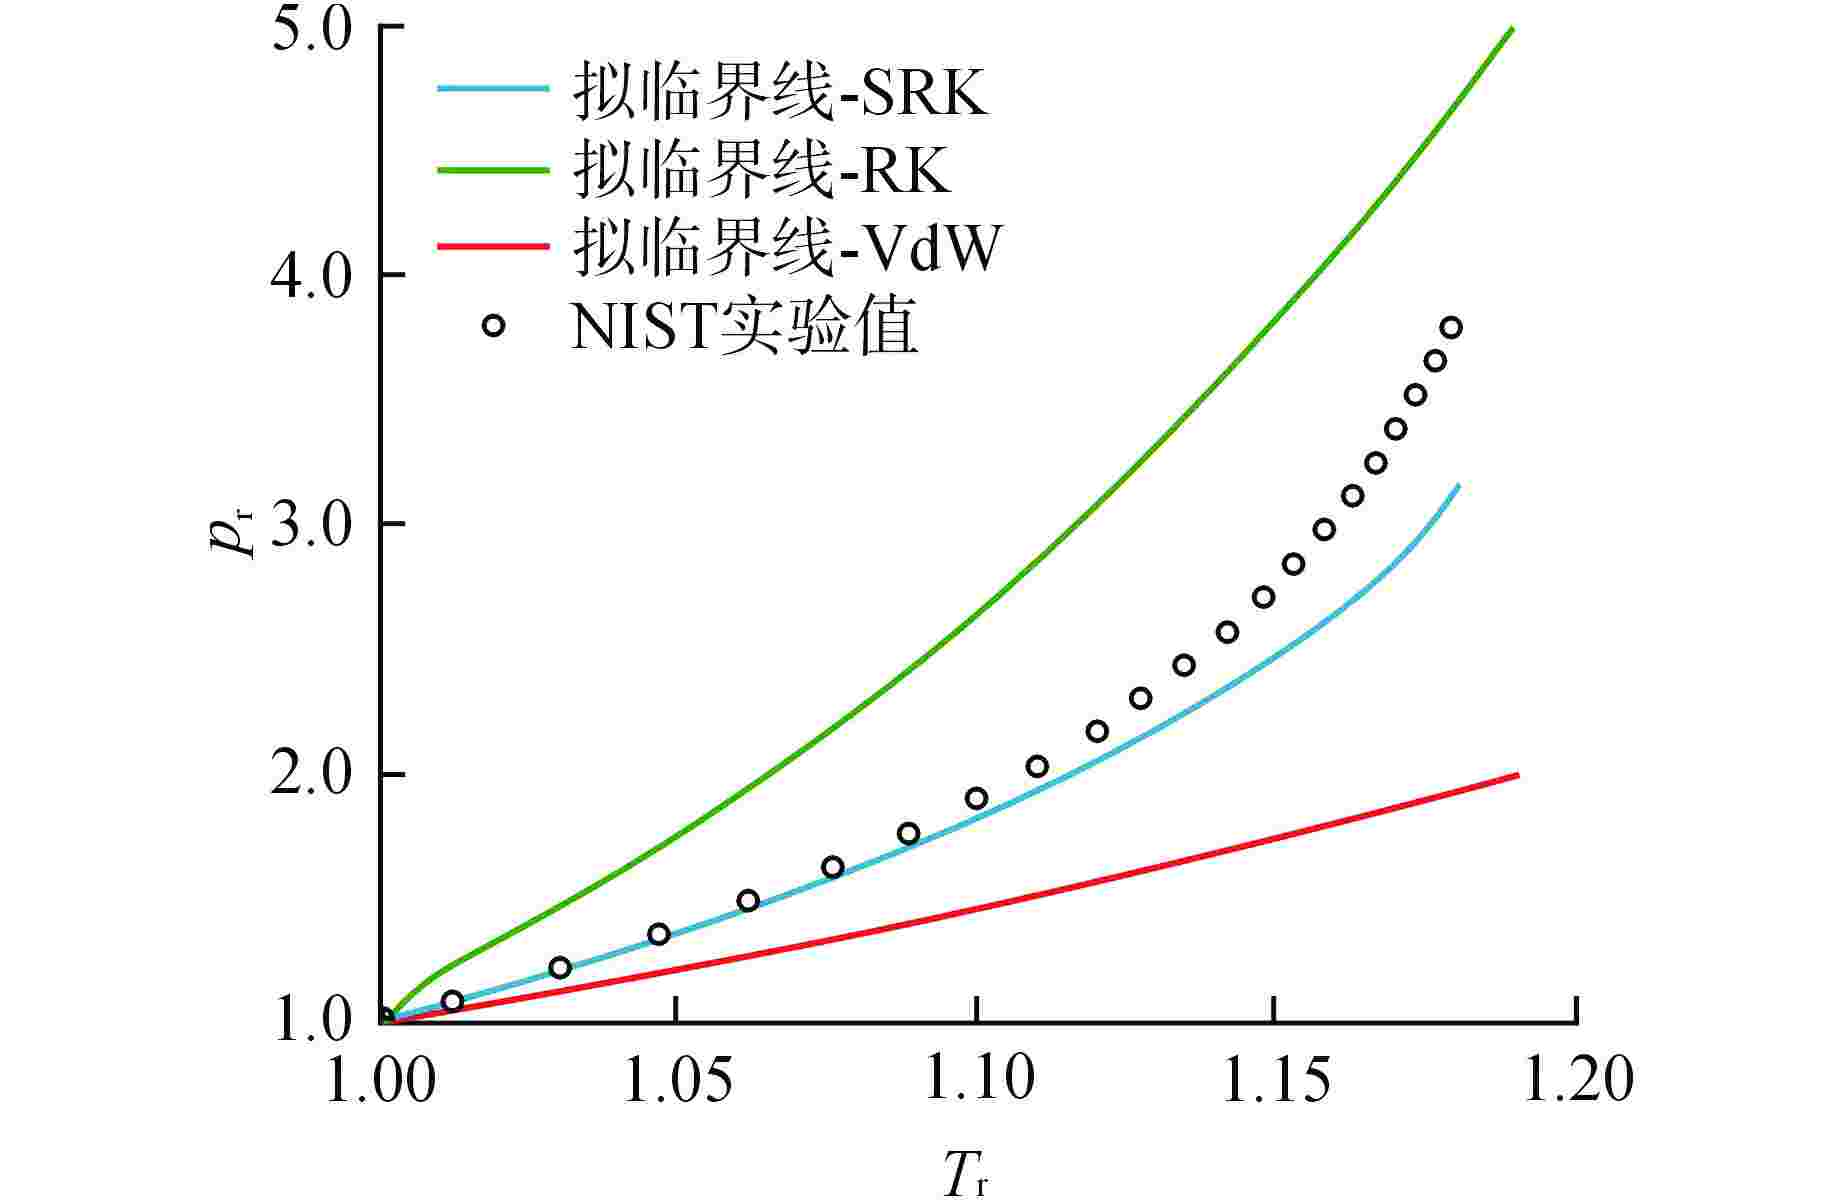
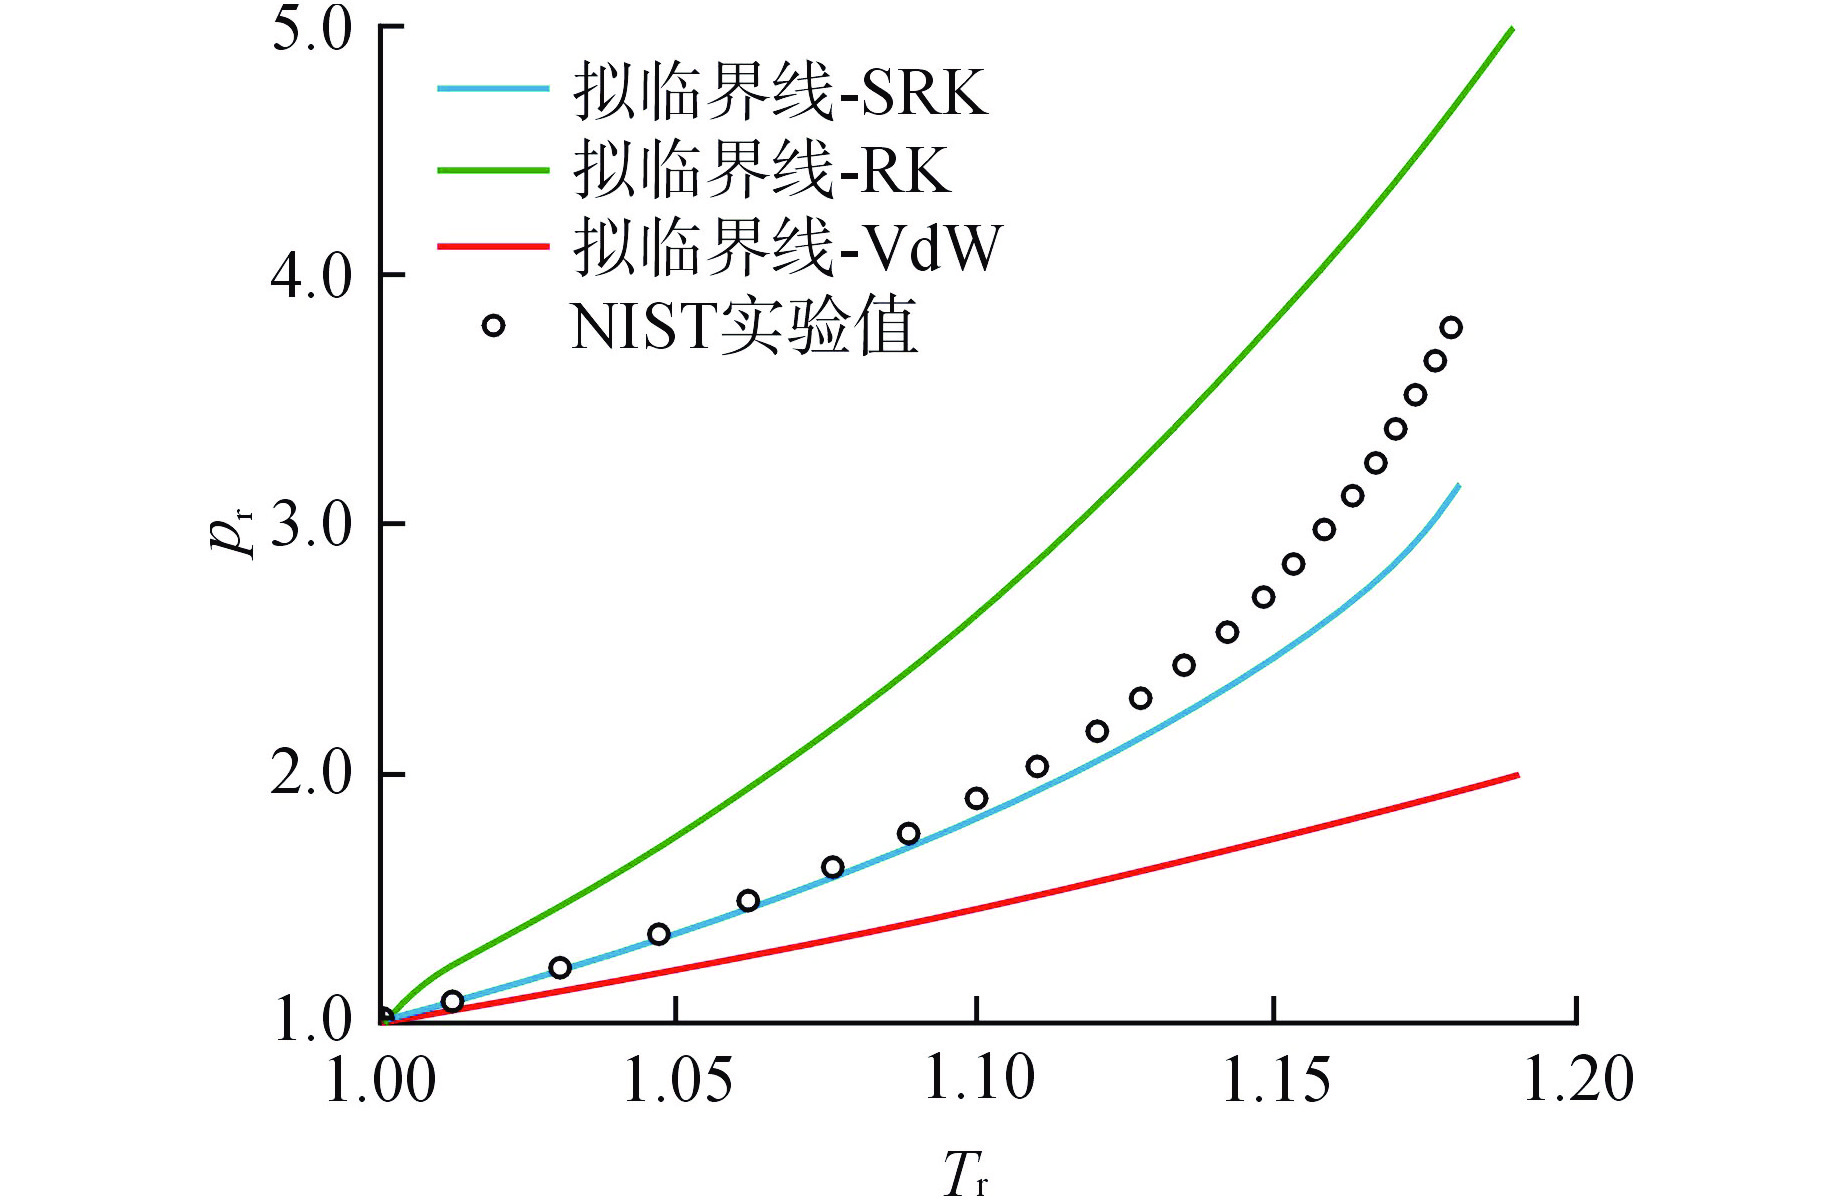
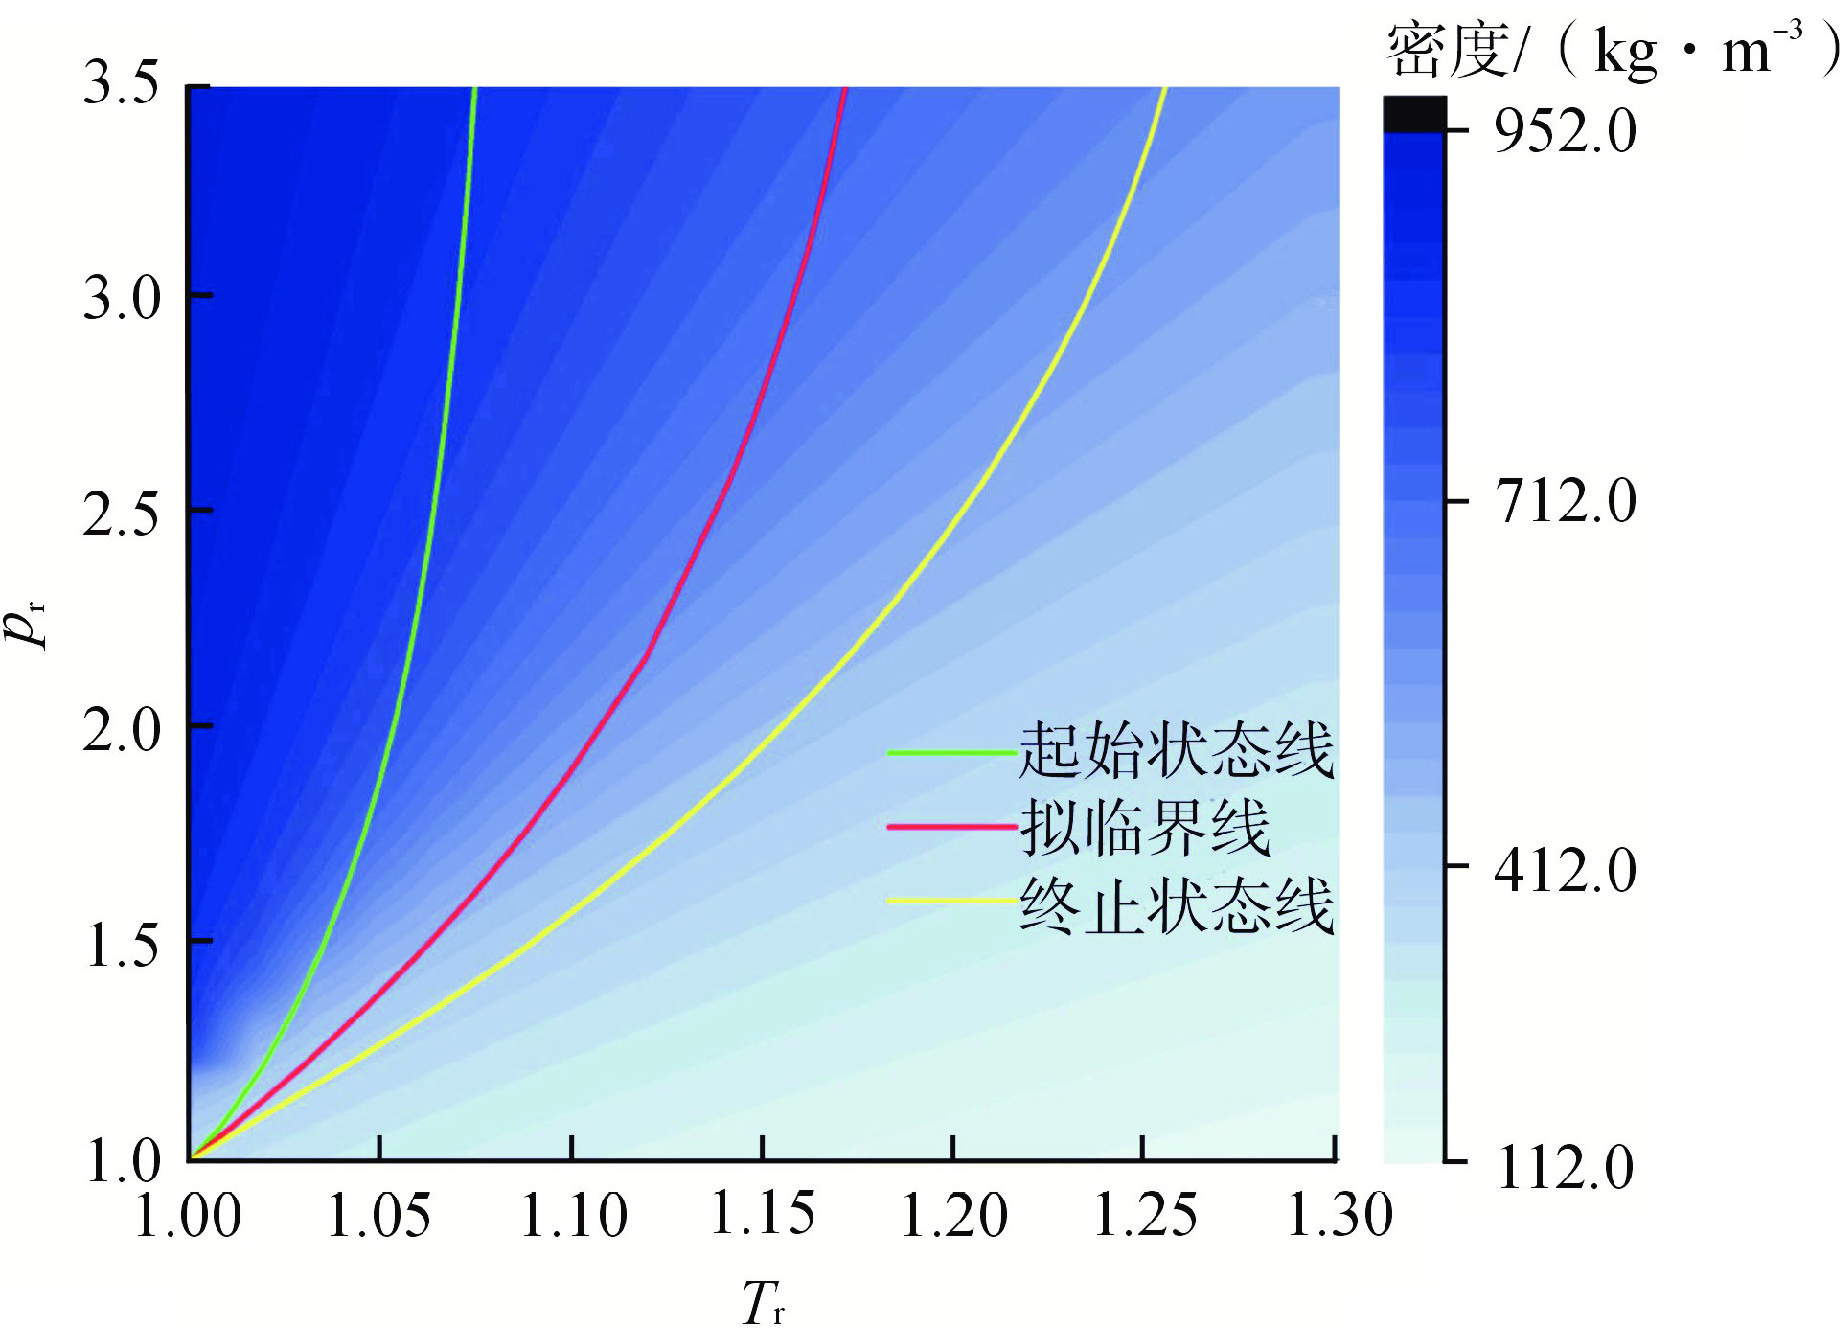
图 3 基于SRK方程的超临界二氧化碳拟临界线
Figure 3. Supercritical CO2 Pseudo-critical Line Based on SRK Equation
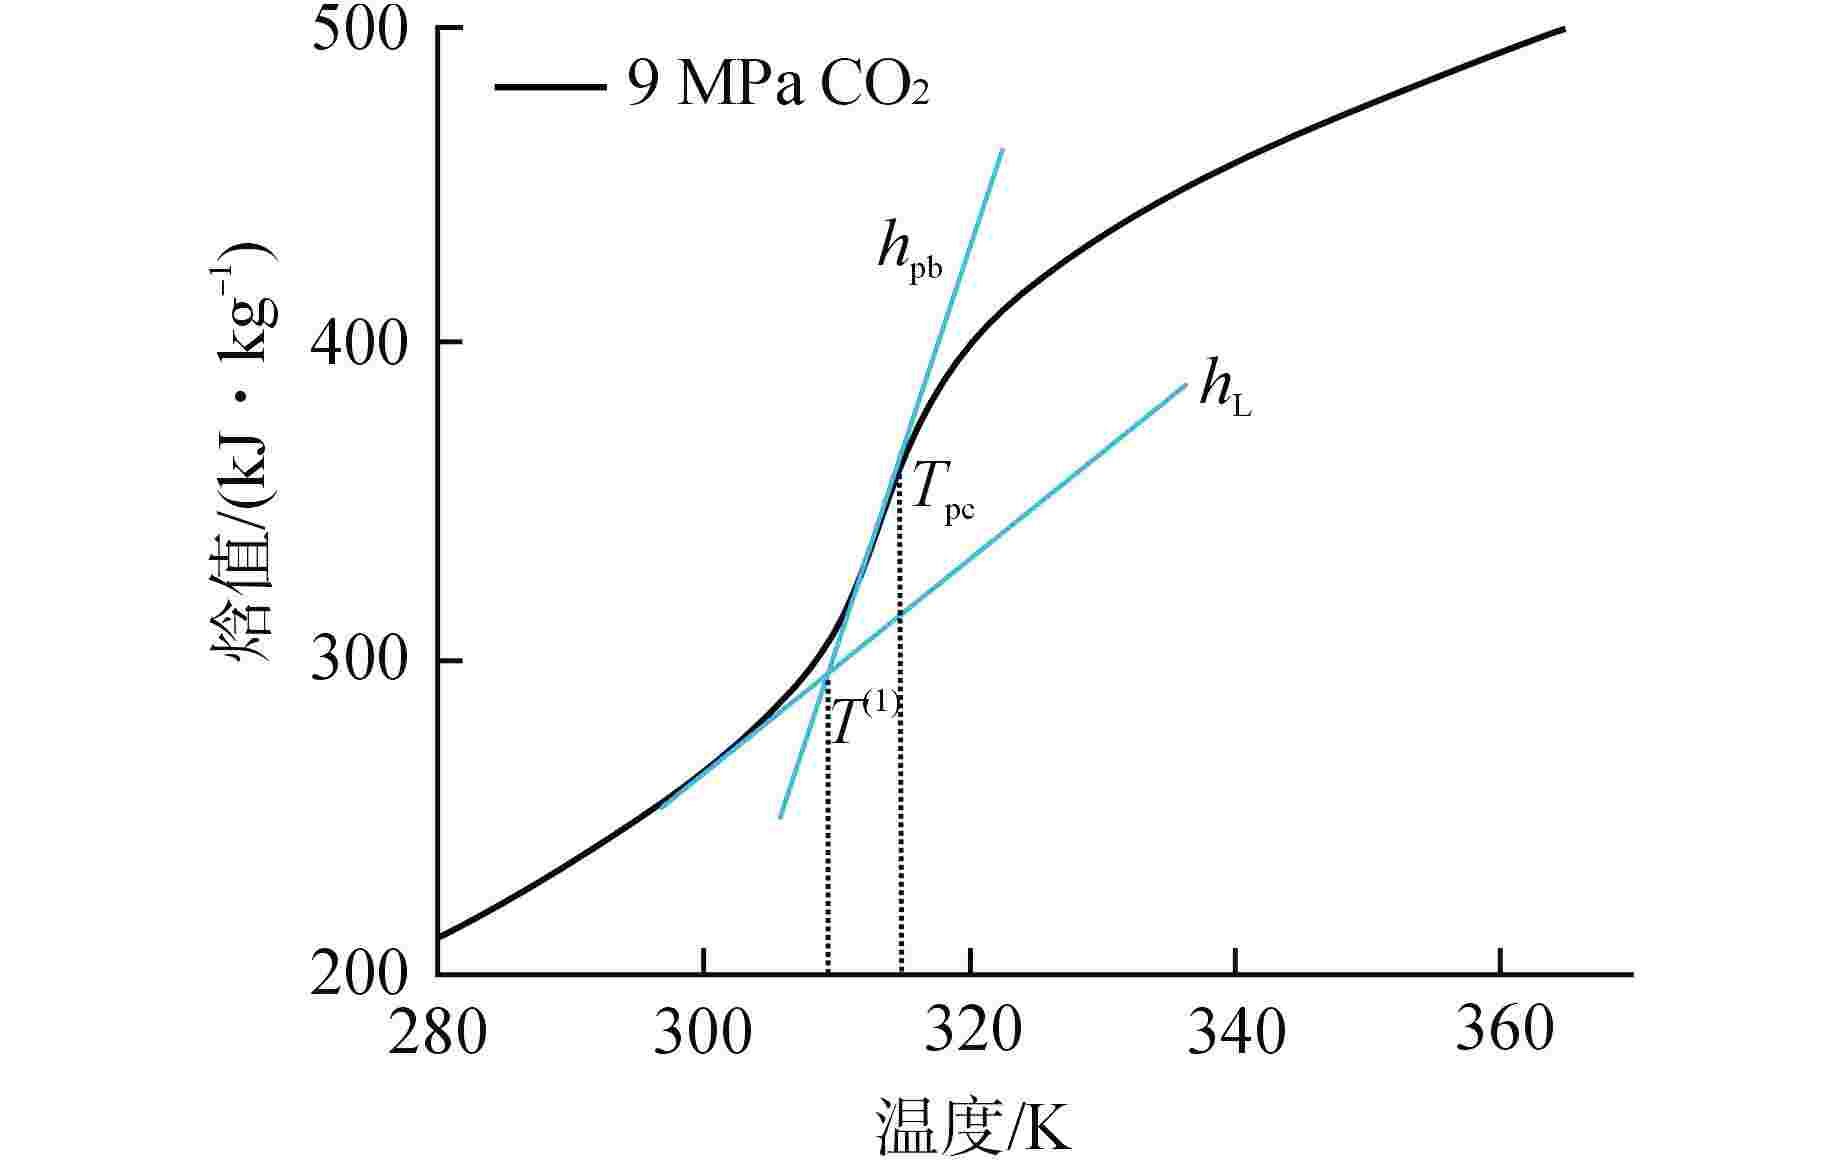
图 5 9 MPa下CO2焓值与温度分布图
Figure 5. Distribution Diagram of CO2 Enthalpy and Temperature at 9 MPa
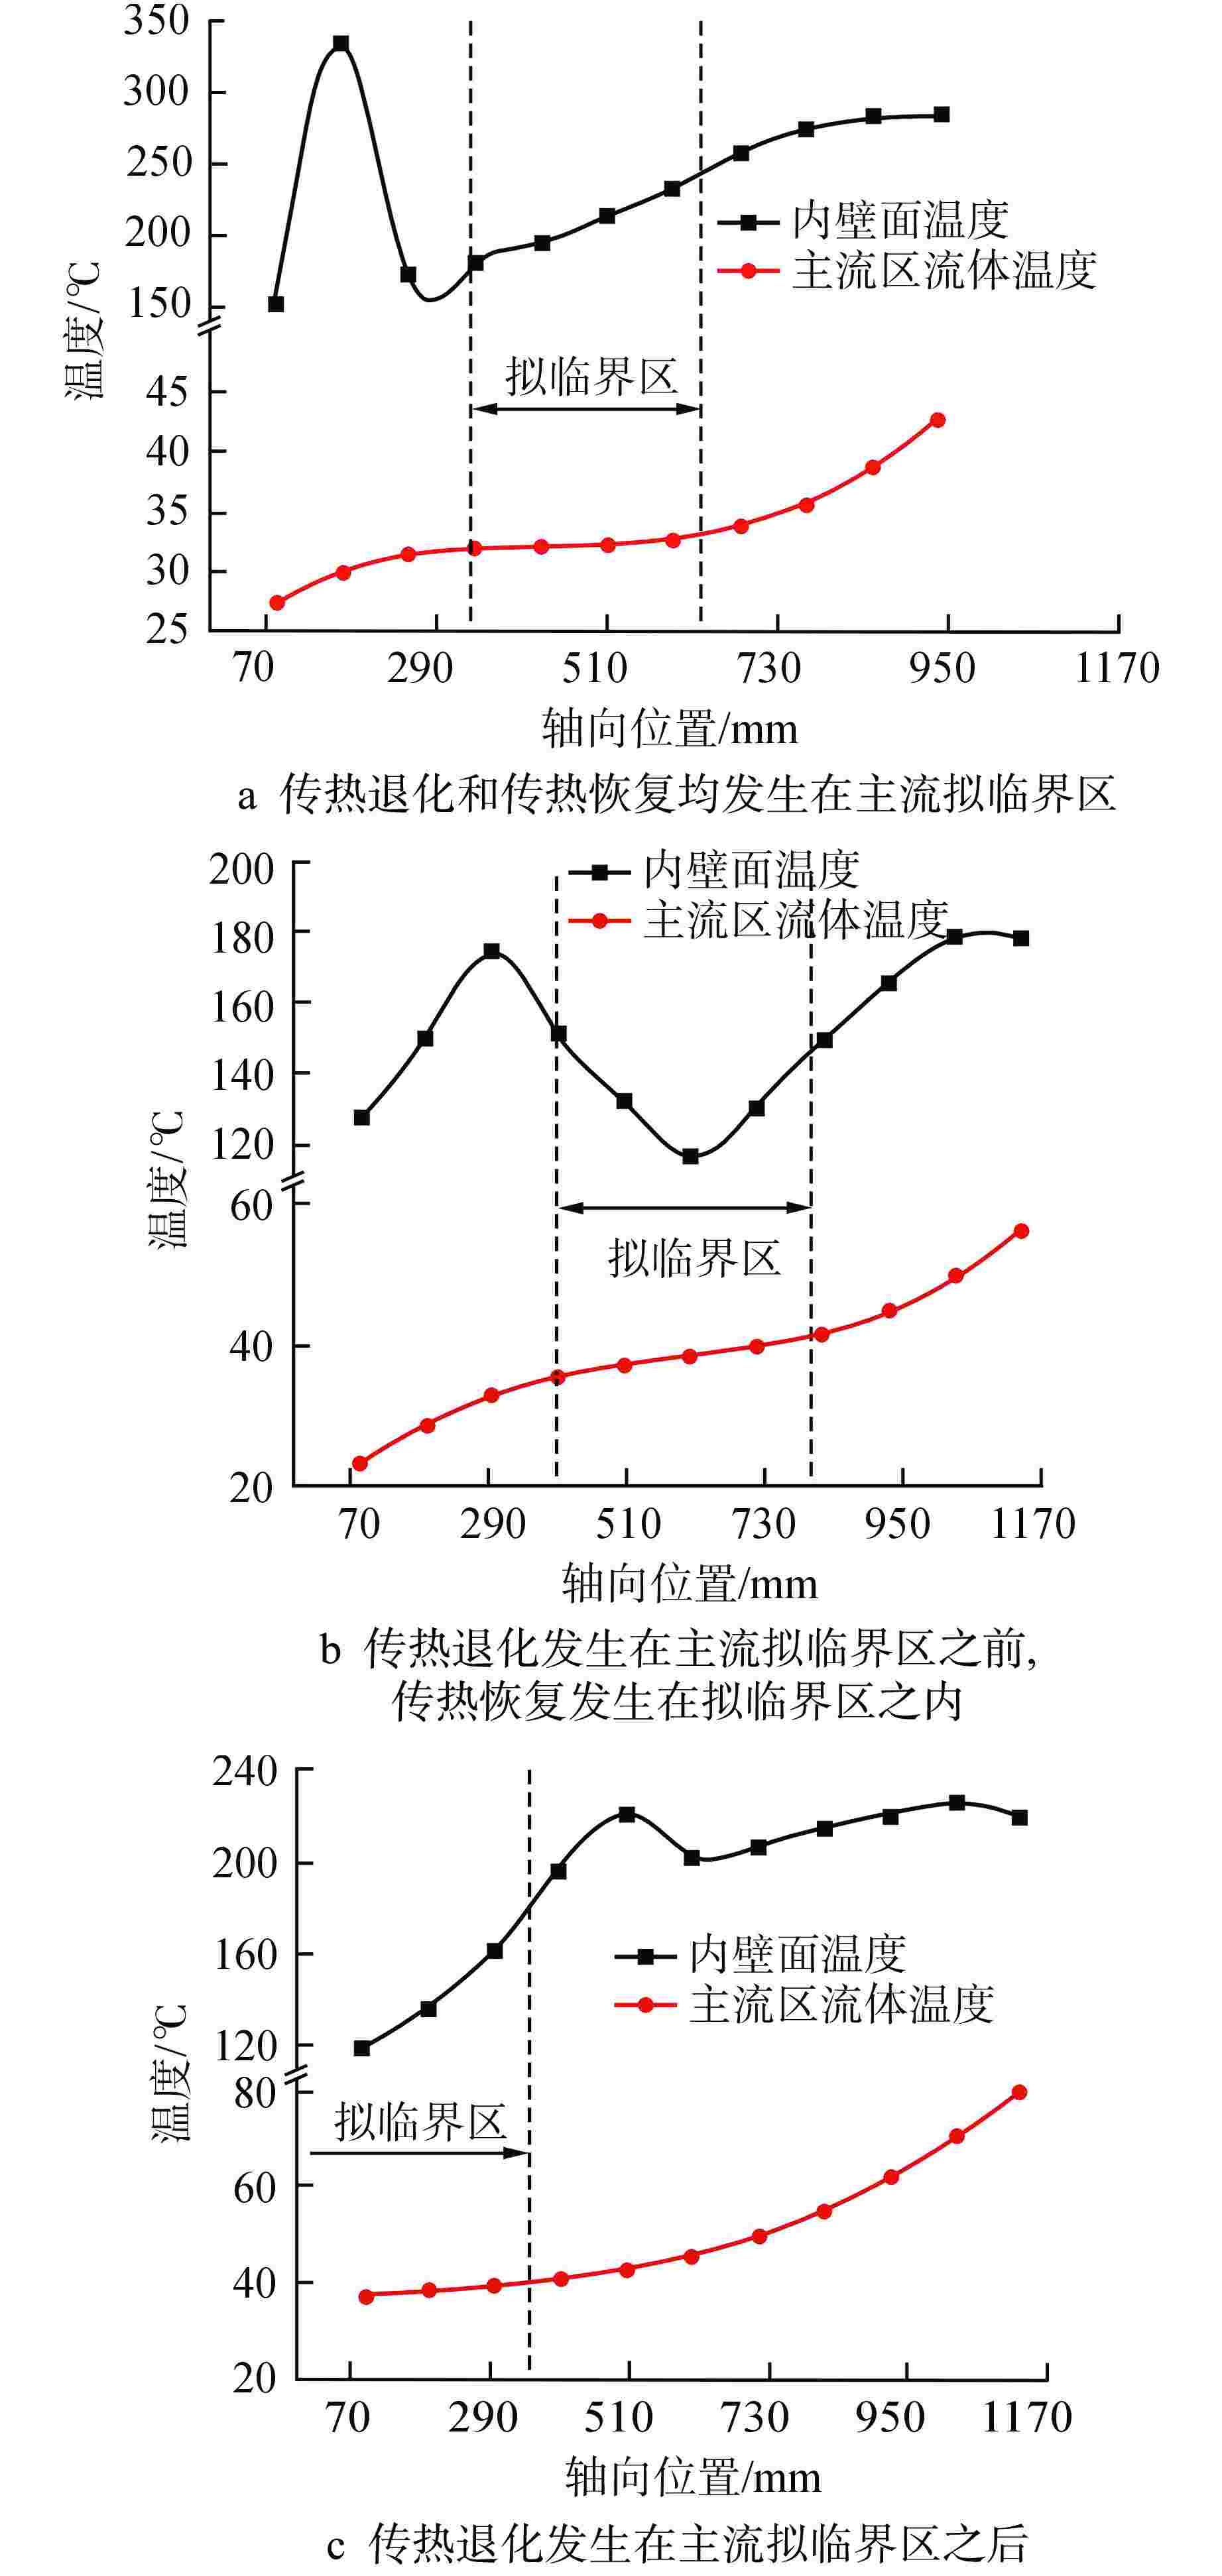
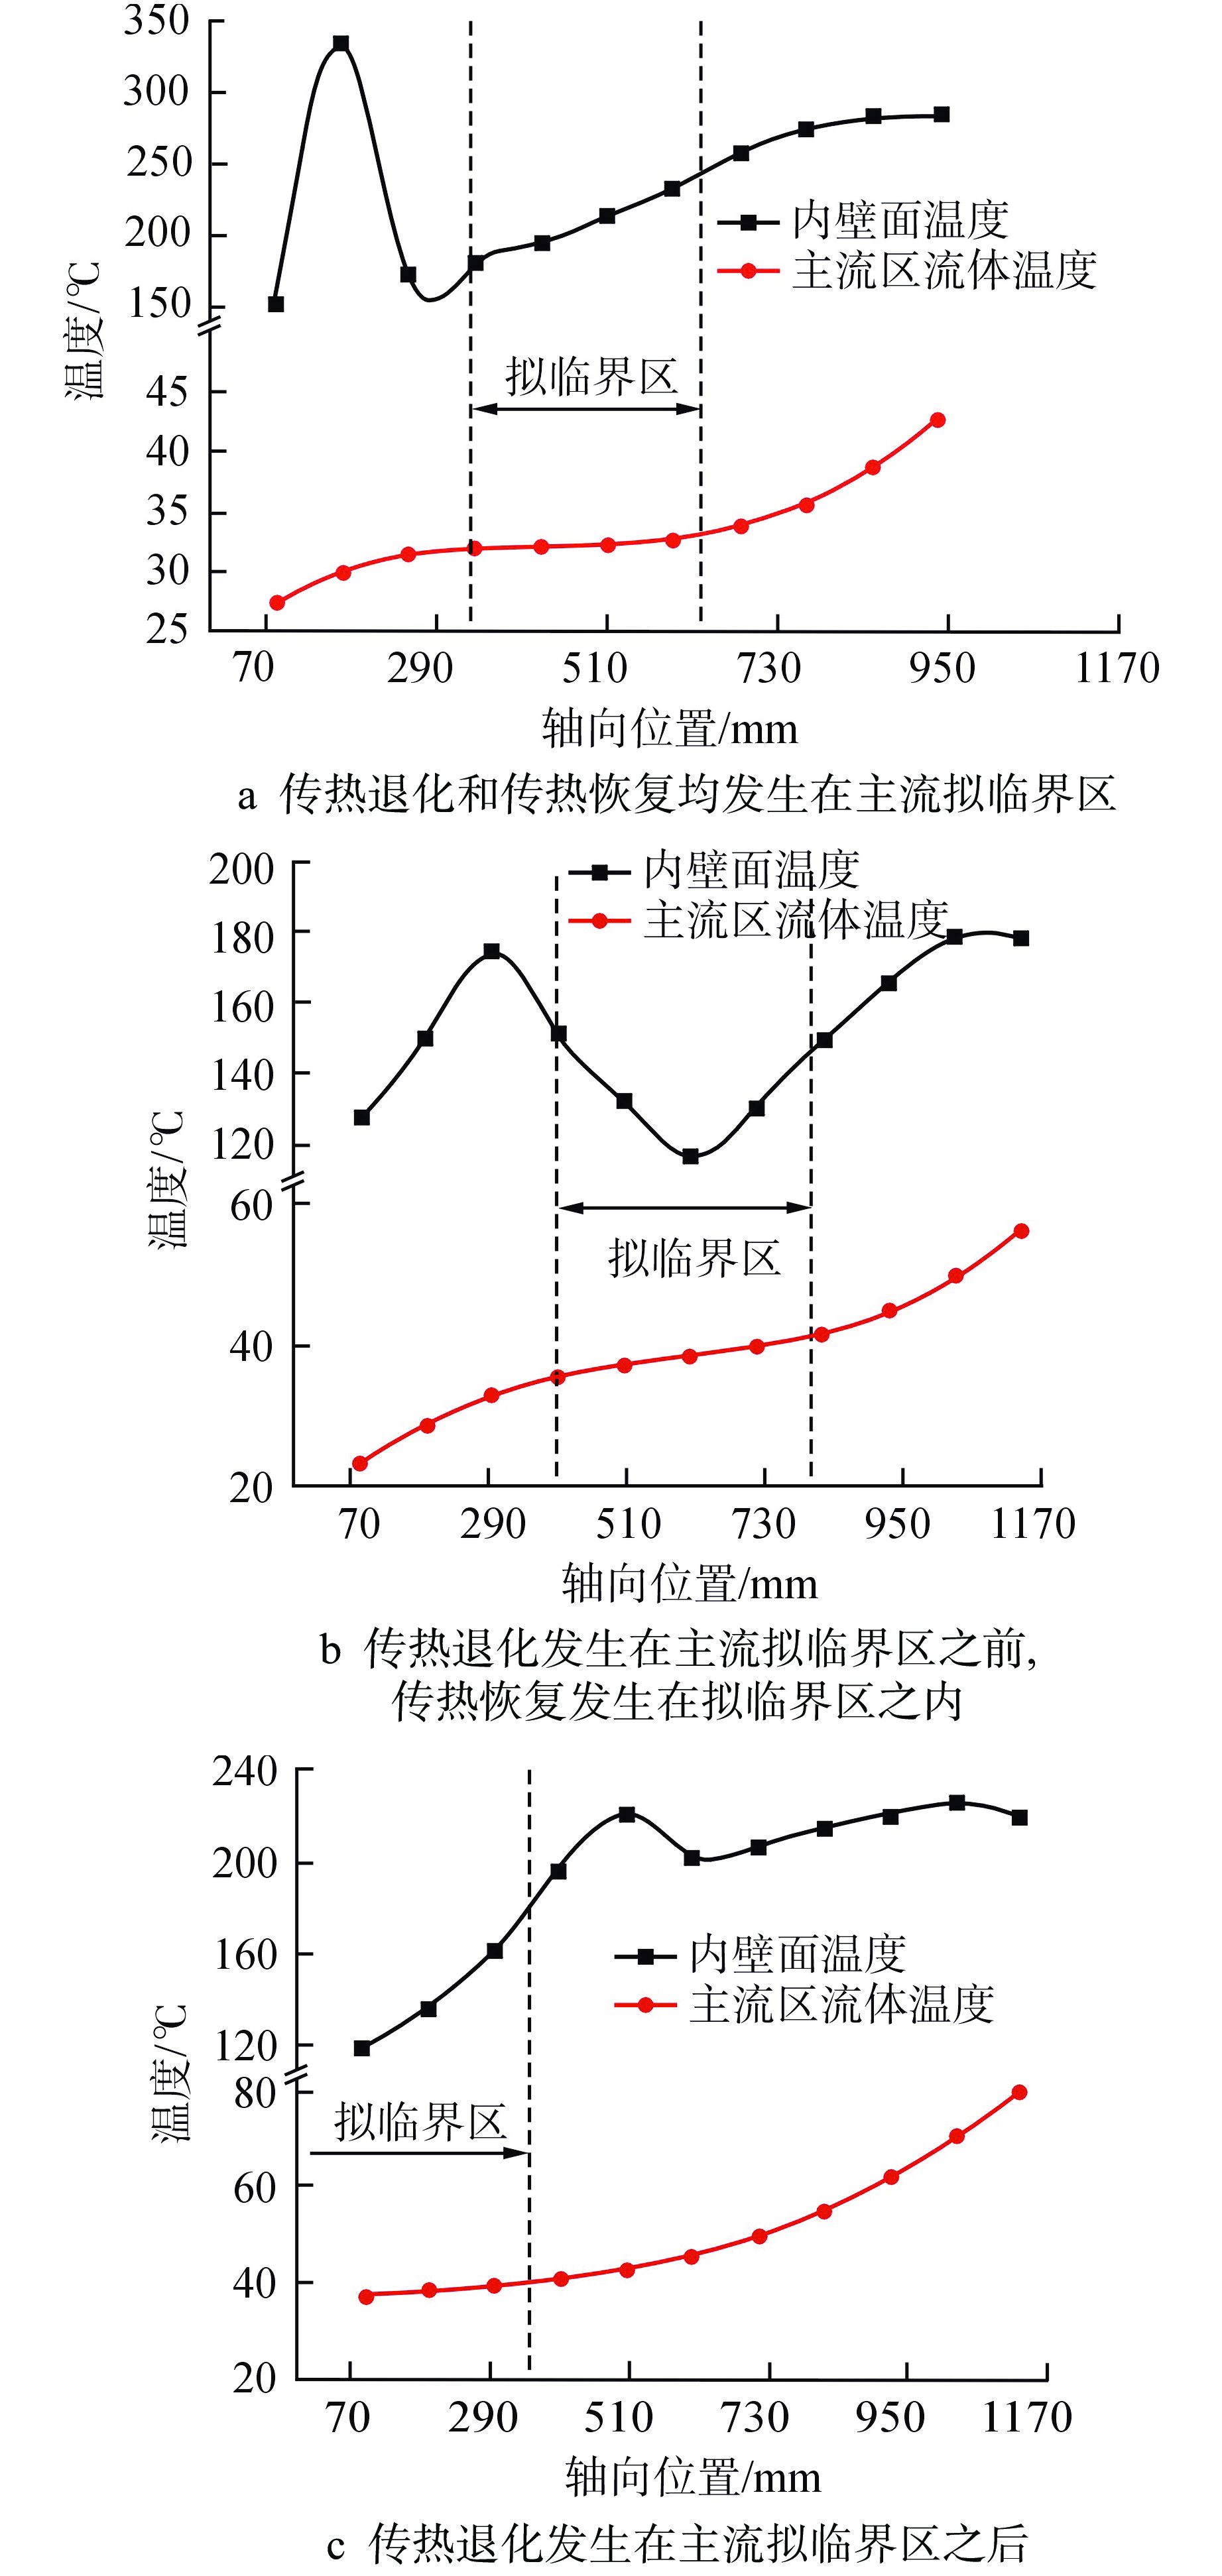
图 8 主流区流体拟临界区对应不同的换热特性
Figure 8. Mainstream Pseudo-critical Zone Corresponds to Different Heat Transfer Characteristics
表 1 传热管尺寸及实验工况表
Table 1. Heat Transfer Tube Size and Experimental Conditions
序号 管子尺
寸/mm长度/
mm运行压
力/MPa质量流速/
(kg·m−2·s−1)热流密度/
(kW·m−2)流向 1 Φ10×2 1200 7.56 606.68 211.57 向上 2 Φ10×2 1200 8.64 889.53 215.28 向上 3 Φ6×2 1200 8.85 1208.67 309.04 向上  下载: 导出CSV
-
[1] SIMEONI G G, BRYK T, GORELLI F A, et al. The Widom line as the crossover between liquid-like and gas-like behaviour in supercritical fluids[J]. Nature Physics, 2010, 6(7): 503-507. doi: 10.1038/nphys1683 [2] ARTEMENKO S, KRIJGSMAN P, MAZUR V. The Widom line for supercritical fluids[J]. Journal of Molecular Liquids, 2017, 238: 122-128. doi: 10.1016/j.molliq.2017.03.107 [3] XU L M, KUMAR P, BULDYREV S V, et al. Relation between the Widom line and the dynamic crossover in systems with a liquid-liquid phase transition[J]. Proceedings of the National Academy of Sciences of the United States of America, 2005, 102(46): 16558-16562. doi: 10.1073/pnas.0507870102 [4] 闫晓,臧金光,曾小康,等. 基于二级相变理论的超临界拟临界区划分方法[J]. 核动力工程,2013, 34(1): 108-113. doi: 10.3969/j.issn.0258-0926.2013.01.023 [5] National Institute of Standards and Technology Chemistry Webbook[DB/OL]. http://webbook.nist.gov/chemistry/, 2022-05-26 [6] 汪志诚.热力学·统计物理[M]. 北京: 高等教育出版社, 2008: 97-99. [7] BANUTI D T. Crossing the Widom-line – Supercritical pseudo-boiling[J]. The Journal of Supercritical Fluids, 2015, 98: 12-16. doi: 10.1016/j.supflu.2014.12.019 [8] 黄彦平. 超临界二氧化碳热质传递与热力循环[M]. 北京: 中国原子能出版社, 2019: 78-79. -


计量
- 文章访问数: 364
- HTML全文浏览量: 116
- PDF下载量: 64
- 被引次数: 0
